Rupee Appreciation Depreciation 2013 Reasons Impact and Future Outlook
Post on: 3 Май, 2015 No Comment

CARE Ratings recently released a report that states their outlook on the future appreciation and depreciation for the Indian Rupee in 2013 with regard to other currencies. This report is reproduced below :
Rupee Appreciation & Depreciation 2012-2013
The rupee has been falling of late raising questions as to where will it eventually go? The rupee has been weak right since the financial year began, which was to begin with more on account of the policies announced relating to retrospective taxation and GAAR.
However, once clarity was brought in, there was a tendency for the rupee to stabilize at a stronger range in September and October as foreign funds flowed in, which was helped further by the positive sentiment unleashed by the policy announcements of the government relating to FDI. In November, the rupee has fallen, and while uncertainty relating to the USA elections did play a role, the fundamentals internally are not that strong.
How has the rupee moved so far?
The rupee has been falling since April and was stable in July-August (Graph 1), before strengthening in September and October, after which it has declined. The decline on a point to point basis is however high at 8.2%.
Rupee Exchange Rate 2013
Besides sentiment, which is difficult to quantify, the exchange rate is driven by basic forces of demand and supply for foreign exchange or dollars as well as extraneous international forces such as the movement in the dollar vis-a-vis the euro.
Data on foreign exchange rate is available on a daily basis but the factors that influence this rate come with different periodicity. The dollar-euro rate and FII inflows, which are major factors that affect the movement, are available on a daily basis. Other fundamentals that affect the exchange rate such as forex reserves, trade balance are available on a weekly and monthly basis respectively. The purpose here is to juxtapose these variables to ascertain if trend lines are available between various variables draw relations between them, and then make conjectures on the likely movements of these variables to take a view on the rupee direction.
One factor that affects the exchange rate is the developments in the dollar-euro rate (Graph 2). The graph below shows, as the dollar rose against the euro till July, the rupee declined. As the dollar declined subsequently, the rupee recovered till around October. In November however, with the dollar declining, the rupee also fell indicating that other factors were also at play.
Cause of Rupee Depreciation
FII inflows have declined by $ 82 mn in November (up to 20th), which can be directly related to the falling rupee in recent times. This was primarily due to net outflows of $ 580 mn in equity while debt inflows were positive at $ 498 mn. Quite clearly the state of flux in the international markets has affected the flow of funds. On a monthly basis, it can be observed from Graph 3 below that the period of rupee depreciation was also the phase when the FII inflows were weak, which were primarily on account of the uncertainty on the tax issues. Their heightened flows subsequently did help to firm up the rupee.
The trade deficit for April October, FY13 was estimated at $ 110 bn which was higher than the deficit of $ 106 bn in FY12. Exports were $ 167 bn as against $ 178 bn registering a negative growth of 6.2% while imports at $ 277 bn, declined by 2.7%. However, oil imports during the period grew by 10%. On this score, hence, fundamentals appear to be weak and point towards a rupee depreciation.
ECB approvals (which would translate into flows in the course of the year) have been at the same level in the first half of the year at around $ 18 bn. This has lent a modicum of stability to the forex capital inflows.
FDI flows during the first 5 months of the year were much lower at $ 8.2 bn as against $ 20.6 bn last year. This has been one of the negative factors which have driven the rupee down in terms of lower supply of dollars.
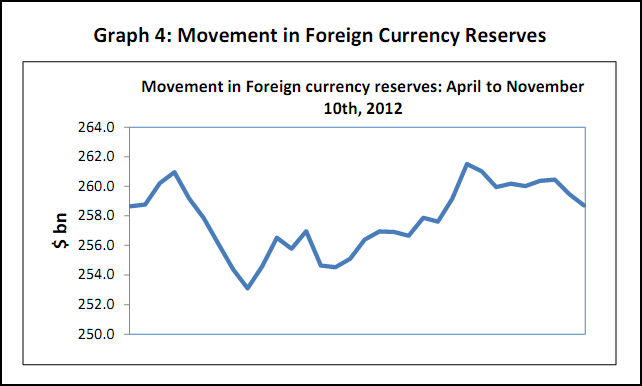
Forex assets (excluding gold and SDR) had declined to around $ 253 bn in May from around $ 260 bn as of March 2012. However, there was a recovery subsequently with lost ground being recovered by October end. However, in November there has been a decline by around $ 1 bn, indicating that the net demand-supply situation is negative. Forex reserves movement is a useful final indicator of all developments in the forex market as it reflects the net demand situation which finally drives the exchange rate. The RBI has in fact sold $ 2.1 bn during the first half of the year, with sales being at a low of $ 10 mn in September. It may be surmised that intervention would be moderate if at all in October, when the rupee remained strong. The weekly movements in foreign currency assets are presented in Graph 4 below.
Indian Rupee Exchange Rate 2013
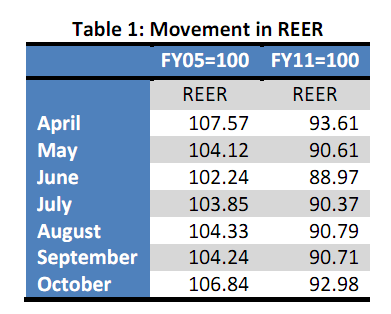
A theoretical concept often used to explain movements in nominal exchange rate is the REER (Real Effective Exchange Rate) which is the nominal rate normalized by domestic inflation relative to world inflation. Given the two base years used here, an increase in the index indicates appreciation of the currency.
Some interesting observations here are:
- In April, May and June, the rupee fell continuously, and the REER showed the same direction.
- The REER showed appreciation in July and August while the rupee fell marginally in August but strengthened in July.
- September has been slightly out of track where the rupee firmed up though the REER indicated otherwise, albeit marginally.
- In October, the REER trend was again observable as the rupee strengthened

Therefore, it appears that the rupee has not deviated too much from the REER in terms of direction.
Future outlook for Rupee in 2013
The following could be the points of influence for the rupee in the coming months.
- Trade deficit will widen as exports will be subdued given low growth in two major regions: Euro and USA. The fiscal cliff in USA and austerity in euro region may slowdown growth in 2012 and early 2013. The current account balance will be under pressure and would be in the region of 3.7-3.8% of GDP for the year provided oil prices do not rise sharply.
- Oil imports have increased despite stable prices meaning thereby that demand has increased, which will pressurize the trade balance. The Gaza crisis and its resolution would hold the key here.
- ECB flows could help to get in the dollars and RBI policy on the same will be useful especially in a situation where global interest rates will be attractive. However forex risk will be an important factor here.
- FDI will continue to be weak this year as outflows from the developed world would be low given the economic conditions. FII funds will have to compensate for the same.
- The euro-dollar relation will remain nebulous as the stress points keep alternating.
- Sentiment would play a role in two ways:
- Changes in policies and economic numbers would work in the short run.
- RBI action will be critical. As of now the RBI has maintained that it will intervene only in case there is extreme volatility.
On the whole it is expected that the capital flows will help to cover the current account deficit and the rupee will remain in the range of Rs 54-56/$ for most part of the year. The deviations would be only temporary in either direction. Looking at the forex derivative markets, the December contract is in the range of Rs 55-55.50/$ while that for March is around Rs 56. It may be conjectured that the market too is looking at a similar range.
(Note: all data from RBI and SEBI. Dollar euro data is from Pacific Exchange Rate Services)
Th is report is prepared by the Economics Division of Credit Analysis & Research Limited [CARE]. CARE has taken utmost care to ensure a ccuracy and objectivity while developing this report based on information available in public domain. However, neither the a ccuracy nor completeness of information contained in this report is guaranteed. CARE is not responsible for any errors or omissions in analysis/inferences/views or for results obtained from the use of information contained in this report and especially states that CARE (including all divisions) has no financial liability whatsoever to the user of this report.


