Reading The Charts The Fundamentals Of Technical Analysis
Post on: 4 Май, 2015 No Comment

Technical Analysis is an indispensable tool towards a successful investment in precious metals, and charts are the most fundamental aspect of technical analysis. Reading the charts is a learned skill, since it is important that you clearly understand what is shown on each chart and the significance of the information they provide. Nevertheless you may rest assured that financial writers will always go out their way to present their work in simple terms and make it comprehensible and thus useful to their readers.
Since last year’s unreasonable chain of events in the gold and silver markets, investors have sensibly become more cautious and reserved when it comes to managing their savings and their investment portfolio. Let it be said that charts and technical analysis have always been trusted tools for traditional investors who knew better than to disregard statistics and ignore fundamental analysis of the market.
Reading all kinds of charts
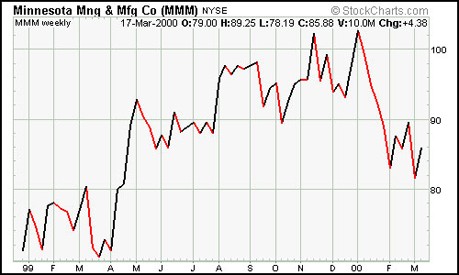
Price charts are the most commonly used technical analysis charts as they provide vital information regarding resistance and support points as well as the short term market trend. Line price chartsare the most basic type, representing only the closing prices over a set period of time. Thisis often considered to be the most important price in standard data collection compared to high, lowand opening pricesfor the day. For micro analysis though, this will not suffice.
Bar charts, coloured candlestick charts and 24-hour live charts provide visual information of the trading range for the individual points such as the high, low, opening and closing prices. Last Friday’s (May 16) 24-hour gold chart displays an impressive downward spike in mid- session testing the $ 1,290 per ounce support point and verifying its strength as prices bounced violently upwards. This week’s session opened with a fierce leap towards the $ 1,300 per ounce resistance point which seems to be getting weaker and weaker, but still holding up. In near-term micro analysis, this is priceless information.
In just a few simple words, these two points indicate that if you are interested in buying gold in the foreseeable future, you should not risk waiting for prices to drop significantly below current levels, as strong resistance is forming at progressively higher levels. On the other hand, if the $ 1,300 an ounce barrier subsides (this does not appear to be happening at the moment) there is no resistance to at least a 5 % rise. Dots and lines used for the mathematical representation of the analysis connect high and low points clearly indicating momentum and trend.

Reading technical analysis articles
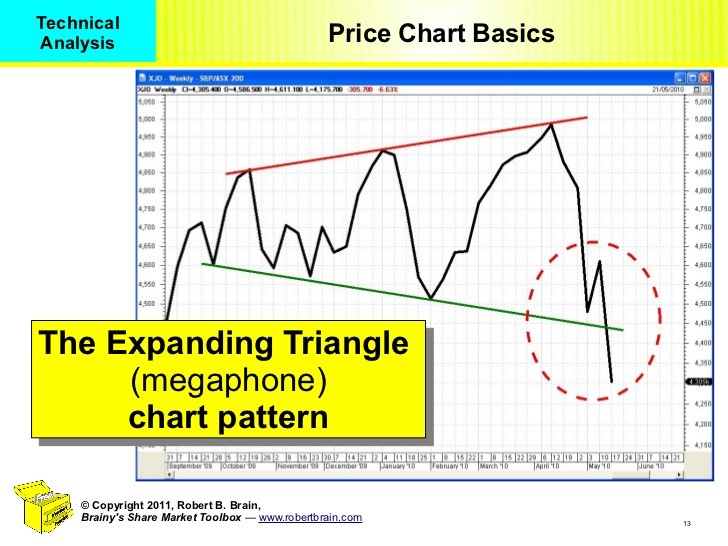
Before you decide that dealing with price and volume charts with wavy lines representing price averages or parallel lines forming canals within which prices are moving is too much for you, remember that technical analysis articles are written by financial experts but are in fact addressing a general audience, and all the deductions and conclusions are clearly stated, explained and analysed.
Visiting the platform of coininvestdirect.com, is the sure way to be updated with charts, technical analysis articles, together with all data and information related to your investment in gold and silver bullion .


