Moving Averages
Post on: 16 Март, 2015 No Comment

Moving Averages
Last Updated May 17th, 2012
Overview
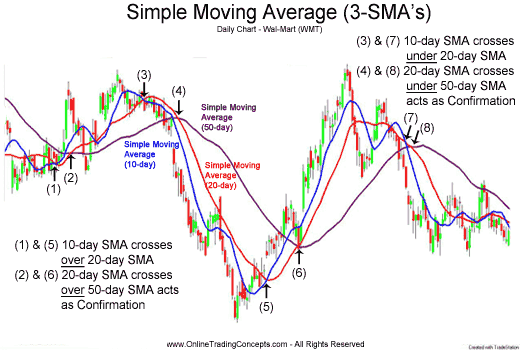
A Moving Average is an indicator that shows the average value of a securitys price over a period of time. When calculating a moving average, a mathematical analysis of the securitys average value over a predetermined time period is made. As the securitys price changes, its average price moves up or down.
There are five popular types of moving averages: simple (also referred to as arithmetic), exponential, triangular, variable, and weighted. Moving averages can be calculated on any data series including a securitys open, high, low, close, volume, or another indicator. A moving average of another moving average is also common.
The only significant difference between the various types of moving averages is the weight assigned to the most recent data. Simple moving averages apply equal weight to the prices. Exponential and weighted averages apply more weight to recent prices. Triangular averages apply more weight to prices in the middle of the time period. And variable moving averages change the weighting based on the volatility of prices.
Interpretation
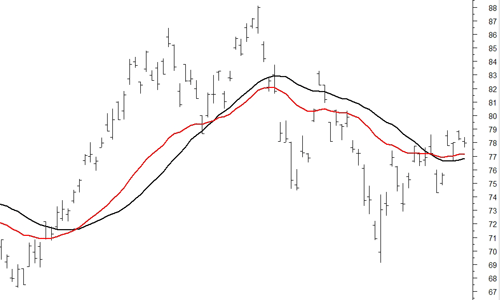
The most popular method of interpreting a moving average is to compare the relationship between a moving average of the securitys price with the securitys price itself. A buy signal is generated when the securitys price rises above its moving average and a sell signal is generated when the securitys price falls below its moving average.
The following chart shows the Dow Jones Industrial Average (DJIA) from 1970 through 1993.

Also displayed is a 15-month simple moving average. Buy arrows were drawn when the DJIAs close rose above its moving average; sell arrows were drawn when it closed below its moving average.
This type of moving average trading system is not intended to get you in at the exact bottom nor out at the exact top. Rather, it is designed to keep you in line with the securitys price trend by buying shortly after the securitys price bottoms and selling shortly after it tops.
The critical element in a moving average is the number of time periods used in calculating the average. When using hindsight, you can always find a moving average that would have been profitable (using a computer, I found that the optimum number of months in the preceding chart would have been 43). The key is to find a moving average that will be consistently profitable. The most popular moving average is the 39-week (or 200-day) moving average. This moving average has an excellent track record in timing the major (long-term) market cycles.
The length of a moving average should fit the market cycle you wish to follow. For example if you determine that a security has a 40-day peak to peak cycle, the ideal moving average length would be 21 days calculated using the following formula:


