Momentum Trading Momentum Indicator Explained
Post on: 23 Май, 2015 No Comment

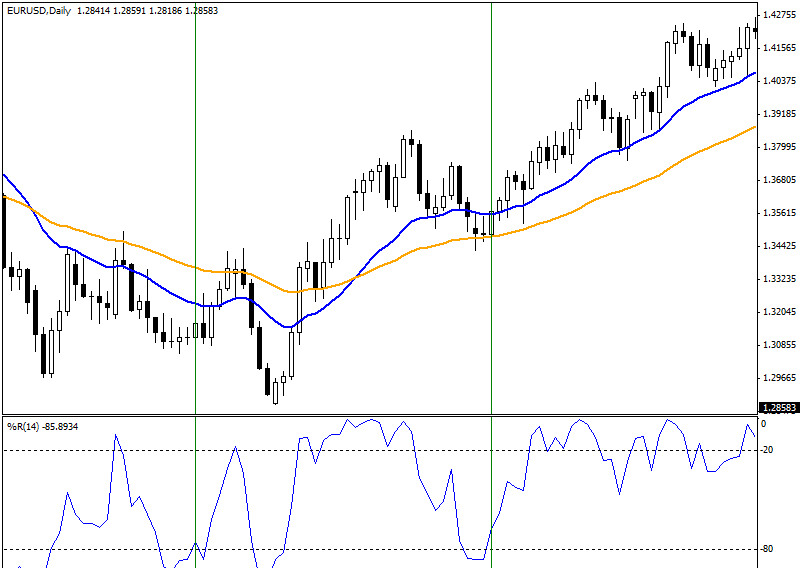
Here are some extra tips when using momentum indicators: go long when momentum crosses to below the oversold level and then rises back above it or on bullish divergences — where the first trough is below the oversold level.
Go short when momentum crosses to above the overbought level and then falls back below it or on a bearish divergence — with the first peak above the overbought level.
In addition: only take signals in the direction of the trend. When there is an uptrend go long if momentum turns upwards when below zero. When there is a downtrend go short if momentum turns downward when above zero.
Now that you’ve seen a bit about S/R indicators, it’s time to introduce another type of technical analysis tools to your arsenal: momentum trading indicators.
Momentum Trading
What is so useful about momentum indicators?
They’re useful for resolving the following kinds of common trader dilemmas that S/R indicators can’t answer. For example:
- A currency pair has broken past all prior S/R points, and is making new historic highs or lows, so there aren’t any S/R levels to tell you if it’s a good time to enter or exit a position.
- You missed entering positions early in a trend that has been going on for a while. How can you tell if there is still time to ride the trend? How can you reduce or eliminate the risk that you’re not buying at the top or selling at the bottom? You could wait for a pullback, but by waiting you risk missing even more of the move.
- You’re in a winning trade, and you want to ride it for all it’s worth, but you don’t want to risk staying in too long and losing some of your gains. Or, you’re approaching resistance and your planned exit point. Do you take profits, or leave some or all of the position in hopes of letting profits run with a trailing stop?
Look what happened to gold from May 2009 to August 2011.
FIGURE 8.1 Gold Monthly Chart, July 2005 to December 2011
Source: MetaQuotes Software Corp, and The Sensible Guide To Forex: Safer, Smarter Ways to Survive and Prosper From The Start (Wiley & Sons, 2012)
From May 2009 to August 2011 it kept hitting new all-time highs, and had only eight down months out of 27, rarely pulling back to anything more than very near-term support levels.
Those waiting for significant pullbacks never got in and missed the biggest trend of the year, as gold steadily hit new all time highs.
We traders and investors get paid for being right about what happens in the future. However the S/R indicators we’ve covered thus far tell us about what happened in the past. While that’s helpful for predicting future price behavior, S/R indicators can only tell us about the strength of S/R levels. They’re missing the other half of the picture — they can’t tell us about whether a trend is strong enough to break past a certain S/R level. Moreover, they can’t tell us anything about future price movements when a currency pair or other asset has broken past all prior S/R to new historic highs or lows.
What’s a trader to do? Use a momentum trading style, with momentum indicators.

Momentum Indicators
They can give us a better idea of future price movements because:
- They show whether a trend is strengthening or weakening.
- They can tell you if an asset is overbought or oversold relative the price range over a given prior period.
That helps us decide whether the trend is more likely continue or to reverse direction Knowing these can help you forecast changes and be more profitable.
In short, momentum trading with momentum indicators can give you additional clues to put the odds of being correct even more in your favor.
There are many momentum indicators, but for now we’ll just introduce a few of the most effective and easiest ones to use:
- Double Bollinger Bands.
- Moving average (MA) crossovers.
- Three kinds of basic oscillators: Moving Average Convergence/
Divergence (MACD), Relative Strength Index (RSI), and Stochastics.
Why The Gold Chart? A Brief Introduction To Inter-Market Relationships And How To Profit From Them
By the way, were wondering why we referred to a gold chart in an article on currencies?
The reason is that for a variety of reasons, currencies and commodities are often interrelated, and so at times are traded as proxies for one another.
For example, because Canada is a major oil producer, the CAD often moves with the price of oil. Under certain conditions, it makes more sense to trade a CAD currency pair than oil, and vice versa.
Gold is a special case, because it’s considered the primary hedge against currency devaluation. When investors are worried about the falling value of one of the most widely held currencies (especially the USD and EUR), gold may rise.
Therefore at times when the fundamentals for both the EUR and USD aren’t good, but it’s unclear whether to be long or short the USD, traders will instead play it safe and just go long gold. We’ll see that happening during times when there’s a lot of anxiety about the stability of large parts of the global financial system. For example, gold has tended to rise during bouts of great concern over the EU sovereign debt and banking crisis. In times like those, traders often pile into gold because:
- The EUR looks like it might not even survive
- The Fed may be printing dollars like crazy in order to help out Europe and to bolster the US economy from the fallout of an economic crash in the EU
Indeed, if you compare a time line of the EU crisis and a weekly gold chart that covers those years, you’ll note that gold often spikes to new highs.
We’ll cover this and other inter-market relationships, and how to use them, later.
How They Work
As their name suggests, momentum indicators focus on rate of price change. While the exact mathematical calculations and emphasis vary among momentum indicators, they all attempt to provide a certain perspective on:
- Whether price is changing at a faster or slower pace
- Whether that changing rate indicates trend strength or weakness
For example:
- A steady increase in the speed at which price is rising or falling suggests trend strength
- However, too rapid an acceleration is often interpreted as a sign of ‘trend exhaustion’ or a ‘blow off’ top (or bottom for downtrends) that suggests a final dramatic surge in optimism (or pessimism for downtrends) that drains out the remaining buyers (or sellers for downtrends) and sets up the end of an trend and coming trend reversal.
When that happens, you’ll hear analysts say that the pair is either:
- “Overbought” if price has risen to fast or for too long, and thus is expected to reverse and move lower
- “Oversold” if price has fallen to fast or for too long, and so is expected to move higher
cdn.fxacademy.com/media/59899/7.1 TA Momentum Indicators WithIntro.mp4.mp4


