Introduction to Average True Range Indicator
Post on: 16 Март, 2015 No Comment

J. Welles Wilder
ATR for short, the Average True Range is a technical analysis indicator used to measure volatility in the markets. Developed by J. Welles Welder, the ATR forms an important element in the larger trading systems. Besides ATR, J. Welles Welder is also attributed to other indicators such as the Average Directional index, Relative Strength Index and Parabolic SAR.
Unlike other indicators, the ATR works in the opposite way. Meaning that when the market is at a low, the ATR usually peaks and vice-versa. When trading with the ATR indicator, the higher the value of the ATR, the greater the trend change is probable and conversely, lower the ATR value, the weaker is the trend.
The ATR is not to be mistaken for price trend, but rather price volatility. And you might know that volatility represents market noise.
Constructing the ATR Indicator
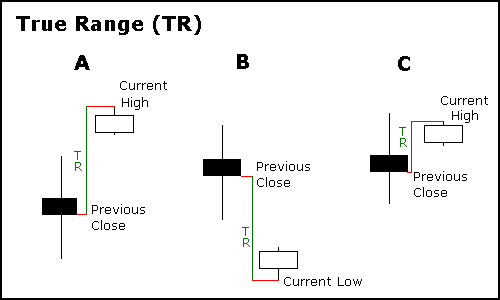
The ATR indicator is constructed based on the true range values for an N-day exponential moving average. The default setting is 14 period. For better understanding, True Range is defined as the difference between the periods high and low price. Example, a days high price minus the low price gives the true range of the market for the particular day.
As can be obvious from the above explanation, the ATR moves based on how fast the range changes. Because the ATR measures volatility, it works similar to Bollinger Bands. Thus using ATR along with Bollinger Band makes either of the two redundant as they measure the same aspect of price.
The ATR can work across different markets and varying time frames.

Average True Range Indicator
Trading with the ATR Indicator
Because of its versatility, the ATR is used as a tool that measures volatility. The ATR is mostly used to identify potential entry/exit signals as well as take profit or stop loss levels. For example, in case of a trending market, traders can place their entry as a multiple of the current ATR value. The ATR indicator should not be mistaken as a directional indicator such as the RSI for example. The Average True Range indicator depicts the level of interest in a securitys price movement. A representation of market noise, significant price movements either up or downward is usually reflected by increase in price ranges and can be seen usually in the beginning of a trend. The ATR indicator thus can be seen as a signal for market validation on the interest behind the price movement.
As mentioned earlier in this article, the ATR is a useful tool for identifying take profit and stop loss levels. As such, it should be understood that the ATR value is based on how much the price has moved over the specified period of time. Therefore, a higher ATR value indicators a larger price change and low ATR values depict a tight ranging market.
A common way to use the ATR as a tool for setting Stop loss is by substracting a multiple of the ATR value from the entry price. The multiple can be either 1.5 or 2 or a value that is deemed relevant to the entry price or the trading system.
So for example, if a prices ATR was 5 pips, so based on the multiple of 2, the stop loss can be set to 10 pips below the market entry price.


