Indicator Settings Configuring Technical Analysis Indicators
Post on: 12 Октябрь, 2015 No Comment

You can opt-out at any time.
Technical analysis indicators are mathematical formulae that day traders use to watch their markets, and decide when to make their trades. Indicators are usually shown on a graphical chart along with the past and current market data (price, volume, etc.), and are updated in real time (i.e. with every price change). Traders watch the graphical chart, and wait for specific patterns to form to signal the entries and exits for their trades.
There are many different indicators to choose from, and they vary in their level of mathematical complication, but they are all configured using similar settings. Different charting software might use different names for the settings (such as a moving average line being called a signal line), but the mathematics will be identical, and will affect the indicators in the same way.
Length
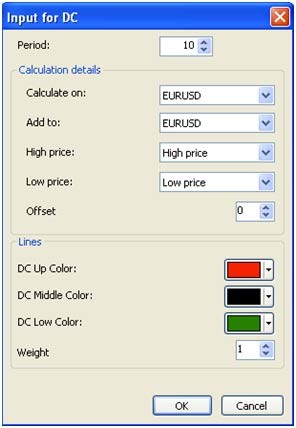
The length is one of the main indicator settings, and is used by almost every indicator. The length specifies the amount of market data that is included in the indicator’s calculations.
For example, a moving average with a length of ten will calculate the average of the most recent ten bars (or candlesticks, etc.).
Signal Length
While technically not part of the actual indicator, many indicators provide a signal line. A signal line is usually a simple moving average of the main indicator line, which creates a slower version of the indicator. The signal length specifies the amount of indicator data that is included in the signal line’s calculation.
For example, a Relative Strength Index (RSI) with a signal length of five will include a signal line based upon the most recent five RSI values in its calculation.
Input Data
The input data setting specifies what the indicator will be based upon, and offers several choices depending upon the chart being used. Bar and candlestick charts allow an indicator to be based upon any of the following:
- Open — The first price traded during the bar or candlestick
- High — The highest price traded during the bar or candlestick
- Low — The lowest price traded during the bar or candlestick
- Close — The last price traded during the bar or candlestick

and most charting software also provide the following choices for most indicators:
- OHLC Average — The average of the opening, highest, lowest, and last prices traded during the bar or candlestick (i.e. (Open + High + Low + Close) / 4)
- HLC Average — The average of the highest, lowest, and last prices traded during the bar or candlestick (i.e. (High + Low + Close) / 3)
Some charting software also allow indicators to be based upon other indicators, and use the other indicator’s values as its input data. For example, a Momentum indicator could use the values from an Exponential Moving Average as its input data, and the Momentum indicator would then show the momentum of the moving average rather than the actual market prices.
Configuration Examples
With most technical analysis indicators, increasing the length setting will appear to slow the indicator down, by making it less susceptible to changes in its input data. For example, a Commodity Channel Index (CCI) with a length of 7 might react to a single large bar, but the same CCI with a length of 14 might not react to the same large bar. If you are using an indicator that appears too jumpy, try increasing the length, and the indicator should calm down.
Many charting software use the close (the last price traded during the bar or candlestick) as the default input data. If the close is the most important price for your trading system then this is the best choice, but if your trading system also uses the high and low, then either the OHLC average or the HLC average might be a better choice for the indicator’s input data.


