How to use Relative Strength Index to identify buy and sell stock prices
Post on: 10 Июнь, 2015 No Comment

At Share Navigator we believe in a top down approach to investing – looking at the macroeconomy and then drilling down into company specifics. After we have done our fundamental analysis and have satisfied ourselves that there is value in a stock, we then look at technical indicators to identify entry points.
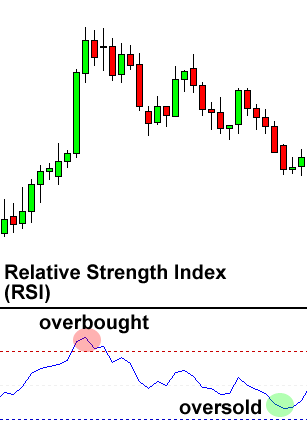
The Relative Strength Index (RSI) is an oscillator that measures current price strength in relation to previous prices. It measures the speed and change of price movements.
RSI can be used to:
- Generate buy and sell signals
- Show overbought and oversold conditions
- Confirm price movement
- Warn of potential price reversals through divergences
In this article we look at some of the uses of RSI.
The chart below of eBay (EBAY) shows how the RSI can generate easy to follow buy and sell signals:
Buy Signal
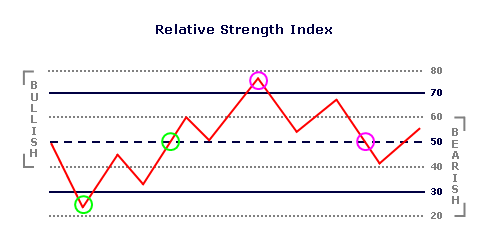
Buy when the RSI crosses above the oversold line (30).
Sell Signal
Sell when the RSI crosses below the overbought line (70).
Varying the time period of the Relative Strength Index can increase or decrease the number of buy and sell signals.
In the chart below of Gold, two RSI time periods are shown, 14-day (default) and 5-day. Notice how decreasing the time period made the RSI more volatile, increasing the number of buy and sell signals substantially.
RSI Buy and Sell Signals

An alternative way that the Relative Strength Index (RSI) gives buy and sell signals is given below:
- Buy when price and the Relative Strength Index are both rising and the RSI crosses above the 50 Line.
- Sell when the price and the RSI are both falling and the RSI crosses below the 50 Line.
An example of this methodology for buying and selling based on 50 Line crosses is given below in the chart of Wal-Mart (WMT):
Relative Strength Index Confirmations & Divergences
A powerful method for using the Relative Strength Index is to confirm price moves and forewarn of potential price reversals through RSI Divergences.
The chart below of the E-mini Nasdaq 100 Futures contract shows the RSI confirming price action and warning of future price reversals:
Low #1 to Low #2
The E-mini Nasdaq 100 Futures contract’s price made a substantial move from Low #1 to Low #2. The RSI confirmed this move, helping a trader have confidence jumping on board the price move higher.
The break of trendline of the e-mini future was also confirmed by the trendline break of the Relative Strength Index, confirming that the price move was likely over.
Low #3 to Low #4
A bullish divergence was registered between Low #3 and Low #4. The e-mini Nasdaq 100 future made lower lows, but the RSI failed to confirm this price move, only making equal lows. An astute trader would see this RSI divergence and begin taking profits from their shortsells.
High #1 to High #2
A bearish divergence occured when the e-mini futures contract made a higher high and the RSI made a lower high. This bearish divergence warned that prices could be reversing trend shortly. A trader should consider reducing their long position, or even completely selling out of their long position.


