Gold Technical Analysis
Post on: 3 Август, 2015 No Comment

In 2011 gold went into a vicious bear market and in 2013 had a panic bear market crash in the summer. Since then it has been trading in a stage one basing phase that will serve as a prelude to a new bull market.
People throw around words like bull and bear market all of the time, but these concepts can’t really help you invest and make decisions unless you are specific about what they mean.
A bear market is more than just a simply 20% or more decline in a financial market. It’s a part of a cyclical repeating price pattern that all markets go through over and over again. It’s not just a specific percent increase or decrease that matters in a market, but the trend analysis you apply to it and the actions you then take.
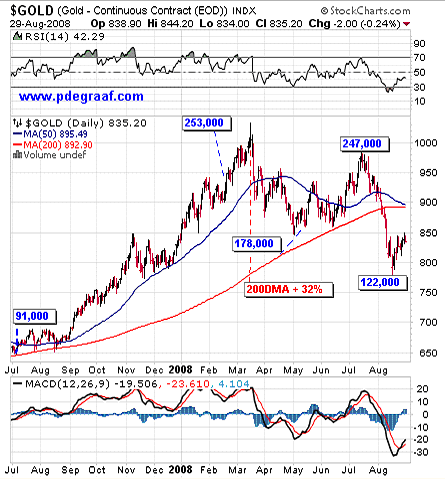
A gold market cycle has four stages to it as you can see in the above chart. During a stage two bull market the long-term 150 and 200-day moving averages slope up and act as support for the price of gold.
Then in a stage four bear market they slope down and act as resistance. As far as technical indicators go these moving averages the most important for you to use and understand.
A stage one basing phase follows a bear market in gold and prepares the way for a new bull market. However, during a stage one phase a market goes up and down and seems to go nowhere. This causes people who have been in the market for a long-time to get frustrated and lose hope and for people not in the market to stop paying attention.
Now you can apply this simple concept of technical analysis to see what is to come.
As you can see since this summer gold has been going sideways in a stage one base with resistance now around 1350 and support at 1200.
Notice how the rate of decline for the long-term 150 and 200-day moving averages is slowing down and those moving averages are starting to go sideways. The 50-day moving average already is.
This is all a sign that a stage one basing phase is in progress.
Those phases normally go on for 6-12 months. This means that we can expect it to end in 2014 and for gold to go into a bull market.

What does that mean for the gold price?
Simple it is going to go higher next year. Now I cannot predict the exact high it will go to, but it could easily reach the 1400-1500 land and go much further than that in the years to follow.
That’s what happens in new bull markets. And you can apply this concept and engage in stock trend analysis of all of the major mining stocks and come to the same conclusion as we have with the price of gold.
Ok what does this mean for you?
There are a lot of people who have lost a ton of money in gold since 2011, because they failed to recognize and adapt to the changing trend. There are just as many people who have no idea what is to come in 2014.
It’s key to understand these concepts. There are a lot of technical analysis books you can buy to learn more. I’ve written one myself called Strategic Stock Trading.
I’ve been in this game since before 2000 and now focus most of my efforts on one pattern that I’ve found to be the most profitable one when it comes to investing. I call it the Two Fold Formula and I have put it together for you in a free PDF. Gold stocks are going to once again be red hot. This is your guide to know which ones to buy.


