Find Profit Targets for Gold
Post on: 26 Июль, 2015 No Comment

Article Summary: Gold has continued its descent after breaking below previous levels of support. With breakout entries triggered, traders eye potential take profit levels.
Last week we described two ways to trade gold (XAU/USD ) using a symmetrical triangle. These patterns of consolidation provide ample trading opportunities for trend. swing. breakout and even range traders alike.These patterns are very popular specifically for their clear entry and profit taking points. Now that gold has broken lower after yesterdays FOMC event, its time to consider potential profit taking points on gold.
For a quick review, below we can see the formation of our symmetrical triangle. Breakout traders were looking to take entries based off the end of this charts consolidation. We now know that price has broken out lower triggering an order entry under previous support. With stops placed in the center of the triangle pattern ,above previous support (now resistance), we can now look to complete our trade idea.
Learn Forex Gold Daily Triangle
(Created using FXCMs Marketscope 2.0 charts)
Now that price has broken out, its time to consider managing risk and then find a potential take profit point. Normally in the event of a breakout, traders will try to place stops where support and resistance converge on our triangle pattern. Pictured above, we can see this value near $1,375. Once a stop is established we can move forward loking for profit targets.
The easisest way to estimate a profit target is through setting a positive risk reward level. A trader that is looking to profit twice as much when they are right, relative to the amount of loss when they are wrong will be setting a 1:2 Risk / Reward ratio. Using this setup on gold, we can measure the distance from our entry to our stop. Knowing that we are risking about $45 on the trade, we can then proceed to find a profit target $90 or better from our entry.
Learn Forex Gold Risk/Reward Strategy
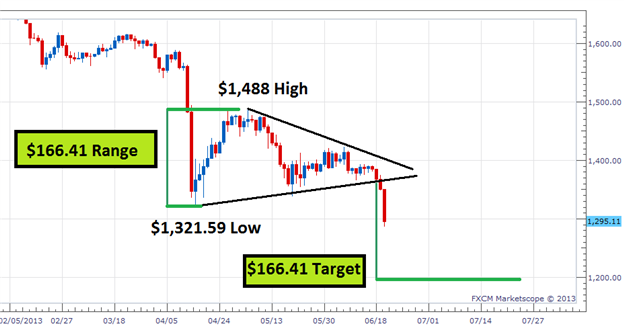
For those that prefer technical methods of establishing profit targets we can again turn to our symmetrical triangle pattern. First, traders should measure the distance between the low and high of the identified triangle. This is depicted below. with the high located at $1,488 and the low established at $1,321.59. The distance between these two points, should be the widest distance between support and resistance in our pattern. Located $166.41 appart, this value can now be applied to finding our profit target.
Traders should next identify exactly where our chart broke out. Pictured below we can see that gold broke through support near $1,365. We can subract $166.41 from this point and establish a profit target near the $1200 an ounce market. It should be noted that if the same stop is used, this will produce a Risk / Reward level of better than 1:3.
Learn Forex Gold Technical Strategy
(Created using FXCMs Marketscope 2.0 charts)
Regardless of where price action ends up on gold, identifying a symmetrical triangle can allow traders to choose from a variety of trading strategies and profit target measures. Remember, planning an exit is always an important
—Written by Walker England, Trading Instructor
To contact Walker, email wengland@fxcm.com. Follow me on Twitter at @WEnglandFX.
To be added to Walkers e-mail distribution list, CLICK HERE and enter in your email information
New to the FX market? Save hours in figuring out what FOREX trading is all about.
Take this free 20 minute New to FX course presented by DailyFX Education. In the course, you will learn about the basics of a FOREX transaction, what leverage is, and how to determine an appropriate amount of leverage for your trading.
Register HERE to start your FOREX learning now!
DailyFX provides forex news and technical analysis on the trends that influence the global currency markets.
Learn forex trading with a free practice account and trading charts from FXCM.


