ESignal Learning Trading Educator s Corner Alan Farley
Post on: 16 Март, 2015 No Comment

Founder and publisher of Hard Right Edge
Focus: Swing Trading
* Not employed by or affiliated with Interactive Data
Alan Farley on Trading Using Fibonacci in eSignal
Voodoo trading could add a lot to your bottom line. Gann, Elliott and other cultists spent years studying the market’s mystical side and how obscure ideas can tap hidden profits. Magic numbers, astrological dates and prayer wheels have all been enlisted in the search for that elusive trading edge.
Most traders believe Fibonacci fits in the category of market witchcraft, but this arcane science has a basis in fact. A 12th century monk (known as Fibonacci) discovered a logical sequence that appears throughout nature. Beginning with 1 + 1, the sum of the last two numbers that precede it creates another Fibonacci number. For example: 1 + 1 = 2, 1 + 2 = 3, 2 + 3 = 5, 3 + 5 = 8, 5 + 8 = 13, 8 + 13 = 21, 13 + 21 = 34, 21 + 34 = 55, and so forth.
eSignal’s advanced charting features make detailed study of Fibonacci retracements, extensions and time series an absolute snap. And, complete customization lets the trader optimize each tool for maximum effectiveness.
Major ratios between Fibonacci numbers identify expected retracement levels as markets pull back after rallies or selloffs. The most common Fib retracements on eSignal’s line tools are 38, 50 and 62%. These are price levels where many traders expect important reversals and bounces. For obvious reasons, these also represent entry signals in many short-term strategies.
Fibonacci and Elliott Wave are kissing cousins. According to Elliott, major rallies or selloffs occur in 3 primary waves, with two countertrend waves in between. These waves are often boxed into major retracement levels. Go back and look at my article Mind the Gaps*. Notice how eSignal’s Fibonacci retracement tools can also define levels where markets jump from one price to another.
Markets swing off common retracements as they move from support to resistance, and back. But, these dynamics have become harder to trade in recent years. The popularity of Fibonacci as a technical tool is the likely culprit. Many smart players now trade against key retracement levels because they know weaker hands will jump in at these prices. For example, they will sell support just because you expect a bounce at that price level.
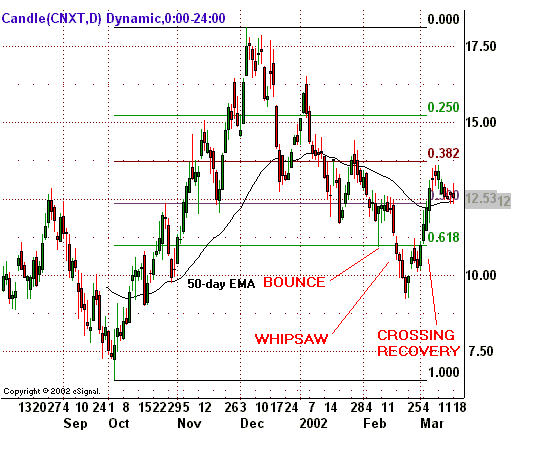
But, eSignal’s Fibonacci tools have tremendous value for swing traders. The trick is to use an original approach. First, never trade a retracement level in a vacuum. Look for other forms of support or resistance to show up at the same price level. For example, when you see a 50-day moving average, an intermediate high and a trendline converge at a 62% retracement, the odds for an important reversal greatly increase.
You can also learn to trade the Fibonacci whipsaw. Stand aside when price pulls back to a deep retracement level. Let other traders take the bait and get shaken out when price breaks through the number. Then, let the market reverse and jump back across the retracement level. Use this crossing as your entry signal. The markets usually punish only one side of the action at a time.
Apply less common retracement strategies to avoid the crowd. H.M. Gartley described little-known Fibonacci relationships in his 1935 book Profits In The Stock Market. The Gartley Pattern relies on a 78% retracement and represents another way to capitalize on those caught in a 62% whipsaw. This classic setup, first described almost 70 years ago, works just as well now as it did during the Great Depression.
You can also trade Fibonacci extensions, instead of retracements. Veteran trader Larry Pesavento examined an extension trade he called the Butterfly Pattern. This is a complex formation that carries price 27% past a 100% retracement before it reverses. Got that?

Open eSignal’s advanced charting tools, and you’ll be finding Gartleys and Butterflies in no time. The combination of all these waves and ratios can be confusing. But, one of the joys in applying complex Fibonacci math is its ability to confuse most traders. After all, the markets rarely reward the trading style of the majority.
* First published on Alan Farley’s website under The Gap Primer on December 31, 2001 and reprinted on www.esignal.com/education on February 7, 2003.
Read another article from Alan Farley:
Alan’s Educator Credentials
Alan Farley is a highly respected professional trader with an international following. He has been on the scene for more than 16 years as a trader and educator. He is author of the best-selling book The Master Swing Trader. columnist for RealMoney.com, publisher of The Hard Right Edge website and editor of The Daily Swing Trade newsletter.
Alan Farley’s Writings
Alan is the author of a bestseller, The Master Swing Trader. and of a popular column on The Street.com. He has also been featured in Barrons, Smart Money, Tech Week, Active Trader, MoneyCentral, Technical Investor, Bridge Trader, Online Investor, America-Invest and Trading Markets .


