DuPont Method A Starting Point for Performance Analysis
Post on: 16 Март, 2015 No Comment

duPont Method: A Starting Point for Performance Analysis
Return on Investment (ROI) is probably the most common measure of an electrical contracting firm’s performance. However, ROI doesn’t reveal how management can improve this performance. Management must choose a benchmark, then analyze the firm’s performance against it to identify ways to improve ROI. The duPont Analysis Method can serve as a starting point for improving the company’s performance.
Financial ratio use
To illustrate the use of financial ratios, let’s use the hypothetical company Tesla Electric, Inc. (Tesla). Its fiscal year 2001 balance sheet and income statement are as follows:
Total Sales $7,486,000
Earnings before Income Taxes $289,000
Total Assets $2,381,000
Owner’s Equity $1,053,000
Return on Sales
Return on Sales is a measure of operating efficiency that can be calculated directly from a firm’s income statement. Return on Sales is also called “Profit before Tax on Sales” in NECA’s Electrical Contractors’ Financial Performance Report (Financial Performance Report ). There are various ways of calculating Return on Sales but the method used in this article compares earnings before income taxes (EBIT) to total sales. Tesla’s return on sales can be calculated as follows:
Return on Sales= EBIT/Total Sales= [$289,000/$7,486,000] (100)=3.86%
Return on Sales provides a measure of how well the firm can control costs in relation to sales. Generally, the greater its Return on Sales, the less the company spends on labor, materials, equipment, and overhead expenses to generate a dollar of sales.
Return on Investment (ROI)
ROI measures the relationship between a firm’s profits and its investment in assets to generate those profits. A number of different ratios measure ROI. The one you use depends on the investment you are measuring profits against. Two forms of ROI are Return on Assets (ROA) and Return on Equity (ROE).
ROA is a measure of management’s ability to use the firm’s assets to generate profits. ROA can be calculated by comparing specific classes of assets to either earnings before or after taxes. The ROA measurement used here is sometimes called Return on Total Assets because it compares the firm’s EBIT from its income statement with Total Assets from its balance sheet. ROA can be calculated for Tesla as follows:
ROA= EBIT/Total Assets= [$289,000/$2,381,000] (100)=12.14%
Since Total Assets on the balance sheet is equal to total liabilities plus the owner’s equity, ROA reports the company’s return on its total capitalization regardless of the source. Besides the owners, providers of capital include its suppliers that extend trade credit and the bankers that provide a line of credit and long-term loans.
Unlike ROA, which compares EBIT to total assets, ROE compares EBIT only to the electrical contracting firm’s owner’s equity (OE). OE represents the total investment that these owners have made in the firm to date and includes both paid in capital and earnings reinvested in the firm. ROE excludes debt from the comparison and only considers the return on OE. As with ROA, a variety of refinements can be made in calculating ROE to make the comparison more suitable for a particular analysis. For the purposes of this article, ROE will be calculated by dividing EBIT including the firm’s interest expense by OE, the method used in NECA’s Financial Performance Report. Tesla’s ROE can be calculated as follows:
ROE=EBIT/OE= [$289,000/$1,053,000] (100)= 27.45%
Asset Turnover
Asset Turnover resembles Return on Sales in that it measures how efficiently the company uses its assets to generate sales. Where Return on Sales compares EBIT to sales to provide a measure of how leanly the firm operates, Asset Turnover compares sales to total assets to get an indication of how efficiently the company is using its assets to generate sales.
Asset Turnover can be calculated in a number of ways for specific analyses. For example, fixed assets could be used in lieu of total assets to evaluate how efficiently the firm is managing its fixed assets. NECA’s Financial Performance Report provides industry information on both methods of calculating Asset Turnover. Using total sales and total assets, Tesla’s Asset Turnover can be calculated as follows:
Asset Turnover shows how many dollars per year of sales are generated by one dollar of total assets. The greater the Asset Turnover, the more efficiently the firm is using its assets.
Asset Turnover= Total Sales/Total Assets= [$7,486,000/$2,381,000]= 3.14%
Financial Leverage
Financial Leverage compares the firm’s total assets to the owner’s equity to provide a measure of how highly leveraged the firm is. Financial leverage is also called a firm’s “equity multiplier” because it provides a measure of the company’s solvency. It is calculated as follows:
Financial Leverage=Total Assets/OE =[$2,381,000/$1,053,000] (100) = 3.14%
The higher the firm’s Financial Leverage, the more debt it is using to finance its operations, which increases its operating risk. This total debt includes not only bank loans, but also lines of credit and trade credit extended by suppliers. All of this debt requires servicing for the firm to remain solvent. A company with a smaller financial leverage would have greater owner financing and less risk because distributions to owners are not required as principle and interest payments are for bank loans. Conversely, a more highly leveraged firm will probably have a higher ROE than one that is not.
duPont Analysis Method
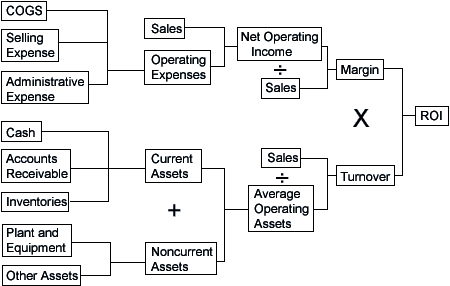
The five financial ratios described in this article can provide valuable information about the firm’s performance. However, all five ratios are interrelated and can be used together to provide greater insights into firm performance than the individual ratios can independently. ROA can be broken down into Return on Sales and Asset Turnover, as shown in the following calculation for Tesla:
ROA= (Return on Sales)(Asset Turnover)= (3.86%(3.14) =12.12%
Similarly, Tesla’s ROE can be broken down into the product of ROA and Financial Leverage as follows:
ROE = (ROA)(Financial Leverage) = (12.14%)(2.26)= 27.45%
DuPont used the four financial ratios to understand their individual contributions to ROE. This analysis is often referred to as the duPont Model or the duPont Analysis Method. The accompanying diagram illustrates the relationships among these five ratios using a duPont Chart.
Benchmark comparison

The ratios become useful only when the firm’s financial ratios are compared to industry or target ratios that the firm has set for itself. Published financial information about electrical contracting firms is available from a variety of sources including NECA’s Financial Performance Report.
The Financial Performance Report provides composite financial statement data and ratios for “high-profit firms,” which it defines as firms whose ROA is in the upper 50 percent of all respondents. This article refers to the composite data as the “High-Profit Profile.”
The five ratios for the High-Profit Profile provided in the Financial Performance Report are as follows:
Return on Sales 7.46%
Return on Assets (ROA) 23.15%
Return on Equity (ROE) 49.02
Asset Turnover 3.16
Financial Leverage 2.09
Analyzing performance
ROE, which measures return on the owner’s investment in the company, was 49.02 percent for the High-Profit Profile, almost double Tesla’s 27.45 percent. To begin to understand why Tesla’s ROE is so different than the High-Profit Profile, you can compare ROA and the Financial Leverage Ratio, which comprise ROE on the second tier of the duPont Chart.
Both the High-Profit Profile and Tesla have nearly the same Financial Leverage Ratio, indicating that their capitalization is nearly the same, and the High-Profit Profile is not more highly leveraged than Tesla. The real difference appears to be in ROA, where the High-Profit Profile is 23.15 percent versus Tesla’s 12.14 percent. To understand why the ROA of the High-Profit Profile exceeds Tesla’s, you need to look at the third tier in the duPont Chart. which breaks ROA down into Return on Sales and Asset Turnover.
Asset Turnover for both the High-Profit Profile and Tesla are about equal, indicating that asset productivity in generating sales is about the same. The real difference appears to be in Return on Sales, where Tesla is only getting 3.86 percent versus the High-Profit Profile of 7.46 percent. Based on this analysis, the difference in ROE between Tesla and the High-Profit Profile appears to be mainly in Tesla’s ability to control its costs in relation to its sales.
The next step
The duPont analysis is only the first step in analyzing the firm’s performance. The next step is to dig deeper into the differences between the firm’s performance and the benchmark against which it is being measured. In the case of Tesla, this benchmark was the High-Profit Profile in NECA’s Financial Performance Report.
Additional analysis can include comparing additional financial ratios and common-size financial statements that facilitate comparisons between firms. Common-size financial statements express everything as a percentage of one financial statement parameter, such as sales on the income statement or total assets on the balance sheet. This analysis can provide the management with valuable insights into how it can improve its operations and increase its ROI. EC
This article results from the development of an executive management education program for electrical contractors that is being sponsored by the Electrical Contracting Foundation, Inc. The author would like to thank the foundation for its continuing support.
GLAVINICH is an Associate Professor in the Department of Civil, Environmental & Architectural Engineering at The University of Kansas. He can be reached at (785) 864-3435 or tglavinich@ku.edu.


