Chart Patterns
Post on: 16 Март, 2015 No Comment

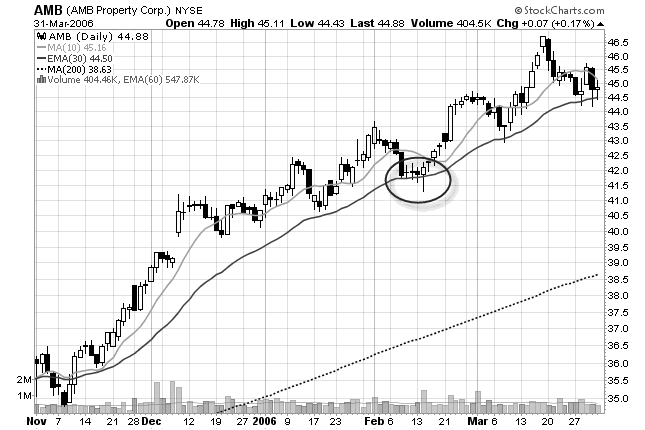
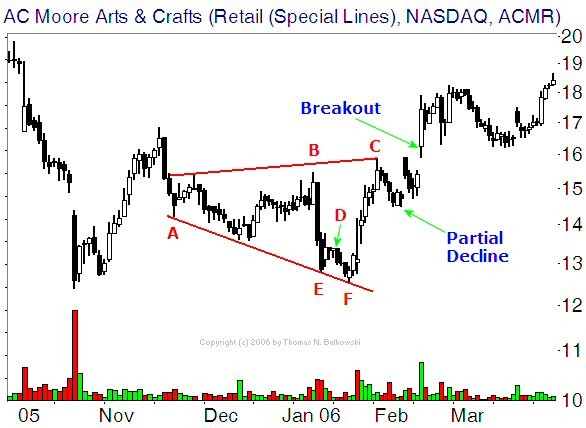
In technical analysis of stock trading, chart patterns play a major role in making trading decisions. As all the traders keep buying and selling a particular stock, the price keep moving up and down, with increased and decreased demand andsupply. This up and down wave like movements, over a period of time form recognizable recurring designs or figurative diagrams.
Just like the patterns formed by the up and down lines in an ECG or an EEG which tells us a lot about the condition of the heart and the brain, the patterns created by the price movements tells us a lot about the status of the price of a stock. I would call it as the EEG of the combined brain of all the traders, which tells us how that combined mind is thinking.
In fact the areas of pattern formations are resting areas. during indecision times, where majority of traders are thinking, to decide whether to buy more or sell more. These oscillations of minds results in the formation of patterns in a chart.
There is a saying that amateurs create the stage for the professionals to play rocking dance. Major portion of the majority of the patterns are created by the amateurs. When the right time comes, professionals enter and take the prices further. This is expressed by the hesitancy seen in the formation of patterns and decisive movements seen after the completion of the patterns.
Although every movement forms a pattern, there are a few recognizable chart patterns which when followed gives us predictable movements in the immediate future on more number of occasions. Taking trades based on these patterns have statistically proved profitable over a period of time. This has shifted the sock trading style from buy and hold type of trading to pattern trading, which statistically gives us more opportunities to have consistent profitable trades.
These patterns may be continuation patterns or reversal patterns.

In a trending market, the stock prices loses their momentum due to profit booking. They rests for a while and make some up and down movements, before they continue their journey, in the direction of the original trend. These patterns formed during these resting periods are termed Continuation Patterns .
Or they may be Reversal Patterns. Here the trend, when exhausted, slows down, forms a pattern before they trend in the opposite direction.
So these patterns alerts us as to the direction of the market. They provide us early signal either to book profit or make a new entry.
Click here to buy books on Chart Patterns


