Candlestick Patterns the Doji
Post on: 16 Март, 2015 No Comment

Stock Trading with Chart Patterns
Candlestick Patterns: the Doji
August 24th, 2011 Steve
Candlestick patterns are very useful for generating trading signals and timing the exact entry point for our trades. In this article we will cover one of the most popular and accurate reversal candlestick patterns: the Doji .
What is the Doji
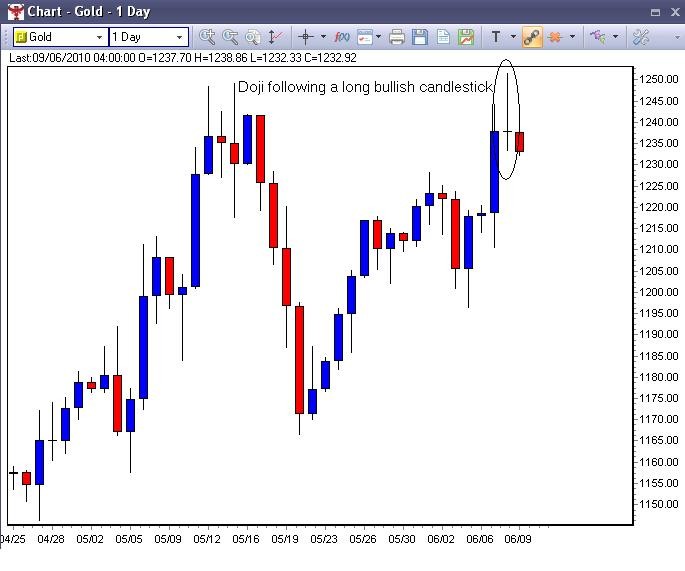
This pattern gave us a very accurate bullish signal
Note that the candlestick signaled exactly when the reversal
was about to happen, giving us a very accurate entry signal.
Type of the Candlestick Pattern. REVERSAL
The Doji is a classical reversal candlestick formation that indicates a possible reversal at the trend, and beginning of a new move.
It is worth noting that a Doji by itself is not a good enough signal to trade, and merely shows a weekness at the trend. However, when the Doji occurs at a support or a resistance level it becomes a viable trading signals and you can enter the trade.
Psychology behind the Candlestick Pattern
The Psychology behind the Doji is the following: By opening and closing at the same price, this candlesticks tells us that the bulls and bears of the market have the same power, and are at equilibrium. If at the previous bars there was a trend and one of the forces had the upper hand, when a Doji is formed it shows that the market is at a sensitive spot and a reversal may happen.
The close distance between the high and low also shows that there was very little struggle between the bulls and bears, showing that they are at equal force and the market temporary lost the velocity.
How to Trade the Doji
As we have mentioned above, we do not trade solely based on the Doji.
We will wait for price to reach a support or resistance level, or pull back to a chart pattern that was broken. After a Doji occurs we will wait for price to reverse and go beyond the lowest low of the Doji (for short trades), or beyond the highest value of the candlestick (for long trades). Only then the trade will be confirmed and we will enter it.

Stop loss should be placed above the reversal candle for short trades, and below it for long trades. Always make sure you place the stop loss this way and exit your trades as soon as price hits the stop loss.
Complex Variations
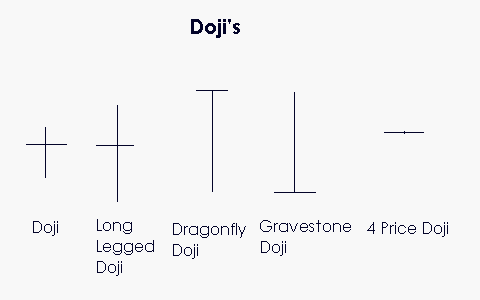
There are several variations of the Doji pattern. for example: the Graveyard Doji .
This pattern is created when there is high difference between the high and the low of the candle, creating the shape that resembles a cross:
Graveyard variation gave us the ultimate reversal signal exactly when it occurred.
It is also a reliable formation that we can trade and use to confirm our trades.
When used in other formations, such as the Morning Star and Evening Star, the Doji formation becomes really powerful and serves as one of the most accurate reversal signals. We will write more about those more complex patterns in the next articles, so stay tuned!
In conclusion, the Doji pattern is one of the most accurate reversal patterns that can help you time your trades and enter precisely before a new trend begins. Once you master the identification of this candlestick formation you will improve your win rate and general profitability significantly.


