Calafia Beach Pundit Key marketbased indicators point to more growth and higher inflation
Post on: 22 Апрель, 2015 No Comment

Virtually all commodity prices are rising, and have been rising since early last year. Several broad-based indices of non-energy commodity prices are now at or close to all-time highs. This is good evidence that global economies are growingdemand is outstripping supply and it likely also reflects the fact that most central banks are being very generous with the supply of money: money is cheap just about everywhere. Cheap money makes it easy to engage in commodity speculation, and it also makes investments in tangible goods more attractive, since they provide a hedge against easy money turning into an unexpectedly large rise in inflation.
Gold is only a few dollars shy of its all-time high, and has been in a rising trend for almost 10 years. It cannot be a coincidence that gold began rising only a few weeks after the Fed surprised the world in early 2001 by cutting the funds rate in response to a weakening economyand then ended up slashing the funds rate from 6.5% to a mere 1.0% by the end of 2003, where it stayed for an entire year. Easy money got the gold rally going, and easy money has sustained the rally ever since. Gold is telling us that the dollar is likely to suffer a significant loss of purchasing power in the future due to overly-easy monetary policy.
The implied volatility of an option contract is a good measure of how much the market values the risk-reducing properties of owning options. This in turn makes implied volatility a good measure of the market’s risk aversion: high implied volatility implies a lot of risk aversion, while low implied volatility suggests the market is very happy to take on risk. Similarly, implied option volatility can be used as a gauge of systemic risk, since it is reasonable to assume that people are willing to pay a lot for options at a time when systemic risk is high or people perceive it to be high. As the above chart shows, the implied volatility of equity index options and Treasury note and bond options today is relatively low, after soaring to unprecedented heights at the peak of the Lehman crisis in late 2008a time when many believed that global financial markets were on the verge of a meltdown. The big decline in implied volatility is good indicator that markets have become much less risk-averse, and that systemic risk has declined significantly. We’re still not back to normal levels, however, which suggests lingering concerns on the part of investors, and that in turn suggests that the equity valuations are not unreasonable high (euphoric price rises often occur when implied volatility is very low and risk aversion is almost nonexistent).
Spreads on 5-yr credit default swaps are a very liquid and reliable measure of the average risk of corporate defaults. While default risk was perceived to be a bit lower earlier this yearwhen it appeared that the economy was displaying surprising strengththe level of spreads today is far lower than it was the height of market panic in late 2008 and early 2009. It’s still higher, though, than the levels that might be considered normal. This confirms the message of implied volatility: corporate bond prices and equity prices still have a substantial risk premium built in, and there is still room for more price gains if economic conditions continue to improve.
Swap spreads are also an excellent indicator of risk aversion and systemic risk (or health, as the case may be). After surging to all-time highs during the height of the late-2008 banking crisis, U.S. swap spreads have led the way down (thus accurately forecasting improving conditions) ever since. There was a brief flare-up of concern last May over Euro (Greece) debt contagion, but those concerns have since passed. Swap spreads in the U.S. are now firmly in a range that would be consistent with normal systemic risk. European swap spreads are still somewhat elevated, however, which means that there is still a good deal of uncertainty surrounding the sovereign debt endgame. But to judge from rising commodity prices and rising equity prices around the globe, the world is not very concerned that the EU debt problem is an end-of-the-world-as-we-know-it type of problem. John Cochrane has a good op-ed in today’s WSJ that explains why the Euro contagion is not a serious risk .

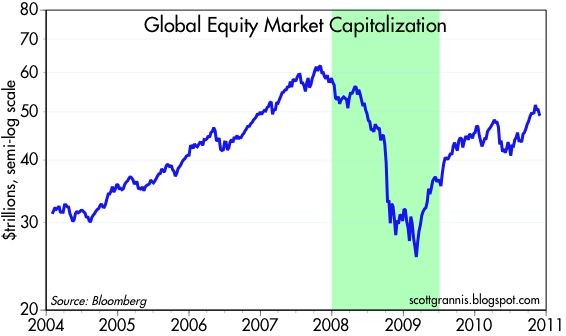
This chart shows the market capitalization of all global equity markets (in dollars). The message of this indicator is clear: the global economy suffered a devastating blow in 2008, but has since recovered a substantial portion of the ground lost. The best explanation for the huge swings in equity values in recent years is this: the reality of today’s economy is an order of magnitude better than it was expected to be just two years ago, when there was almost universal agreement that we were headed for a global financial collapse and a deep depression. It is shocks such as thiswhen the facts turn out to be far different than expectedthat drive huge changes in asset prices. It is not unreasonable to thinkespecially when one reads the countless analysts who continue to doubt that we will see an ongoing recovery, plus all those who worry that European debt contagion will precipitate another global banking crisisthat the future could prove to be better than many people expect, and that equity prices therefore can continue to rise.
The chart above is based on the 13th Fed funds futures contract, which is a good proxy for the market’s expectation of where the funds rate will be in one year’s time. Note how the expected funds rate one year forward fell to a low of 0.2% last month; this is consistent with the market fully embracing the Fed’s plan to proceed with QE2 and keep the funds rate extremely low for a very long time (at least a year). Since then, the doubts about and the criticism of QE2 have been on the rise, and the news on the economy has been better than expected, and that is confirmed by the 17 bps rise in the one-year-forward expected funds rate. In short, the market is expecting the Fed to scale back the scope of QE2 and to begin reversing it sooner than was recently expected, because the need for and the justification of QE are less obvious now. These expectations are also apparent in the 60 bps rise in 10-yr Treasury yields since mid-October.
UPDATE: Below is a chart which combines implied volatility and equity prices, and shows how the decline in risk and risk aversion has coincided (and even tended to precede) the rise in equity prices. As confidence in the future improves, risk-taking is likely to rise too, and that should result in more investment, more growth, and higher equity prices.


