Best Technical Indicators
Post on: 16 Март, 2015 No Comment

Technical indicator is a key to success in swing trading. There are thousands of Wall Street Traders and retailer traders who profit from technical indicator day after day trading the stock market. Technical indicators are best use for day trading and swing trading, but it works for long term investing as well. Each trader has his own set of best technical indicators, and below are my favorite technical indicators that work for me.
1. Candlestick Patterns — it is a very useful tool for charting that allows me to recognize profitable setups easily. In my opinion, candlestick is way better than bar chart or any other chart.
2. Stochastic — I use the stochastic indicator to find when a stock is overbought or oversold so I can add a stock to my watchlist.
3. MACD — MACD is a very powerful technical indicator developed by Gerald Appel in late 1970’s and is an indicator that are widely use by traders around the world.
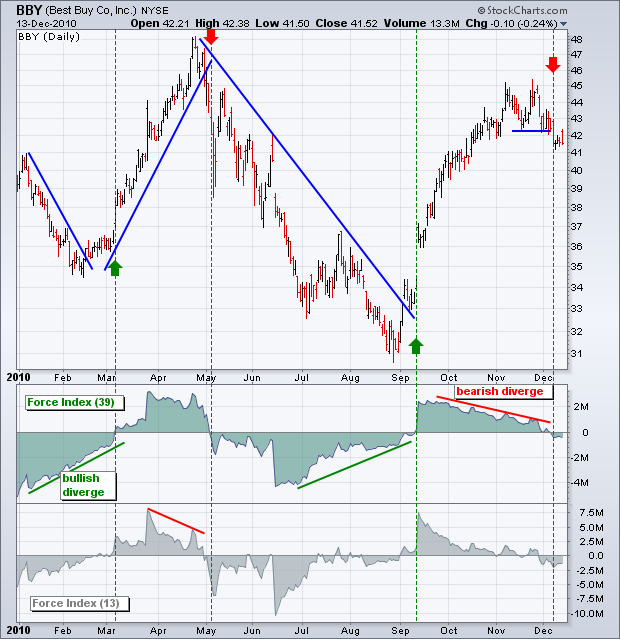
4. Volume — volume is a great indicator to determine if there is momentum on a stock. When a stock goes up with good volume and my other indicators give a buy signal then I jump in with bigger positions. When the volume is low, that generally indicates the trend is not strong enough.
5. Moving Average Orders — this is a great indicator for trend following. When the short term moving average cross above the long term moving average, that indicates strength. For example, when the 10 day moving average crossover the 20 day moving average, that indicates strength in the short term. You can use multiple moving averages if you like such as 10-day, 20-day and 50-day moving averages.

6. Exponential Moving Average Orders — exponential moving average is also great because it gives more weight to the most recent data and therefore is more accurate than the simple moving average.
7. ADX Indicator — ADX is a very good technical indicator to measure the momentum of a stock. It doesn’t care if the stock is going up or down, it only check to see if the trend is strong or not.
8. Bollinger Band — Bollinger Band are used to help you decide when you should buy and when to take profit. You can use it to buy a stock when the lower Bollinger Band touches the moving average, or sell it when the moving average touches the upper Bollinger Band.


