An Introduction To Managed Futures
Post on: 8 Апрель, 2015 No Comment

Many individual and institutional investors search for alternative investment opportunities when there is a lackluster outlook for U.S. equity markets. As investors seek to diversify into different asset classes, most notably hedge funds, many are turning to managed futures as a solution. However, educational material on this alternative investment vehicle is not yet easy to locate. So here we provide a useful (sort of due diligence ) primer on the subject, getting you started with asking the right questions. (For more reading, see Interpreting Volume For The Futures Market .)
Defining Managed Futures
The term managed futures refers to a 30-year-old industry made up of professional money managers who are known as commodity trading advisors (CTAs). CTAs are required to register with the U.S. government’s Commodity Futures Trading Commission (CFTC) before they can offer themselves to the public as money managers. CTAs are also required to go through an FBI deep background check, and provide rigorous disclosure documents (and independent audits of financial statements every year), which are reviewed by the National Futures Association (NFA), a self-regulatory watchdog organization.
CTAs generally manage their clients’ assets using a proprietary trading system or discretionary method that may involve going long or short in futures contracts in areas such as metals (gold, silver), grains (soybeans, corn, wheat), equity indexes (S&P futures, Dow futures, NASDAQ 100 futures), soft commodities (cotton, cocoa, coffee, sugar) as well as foreign currency and U.S government bond futures. In the past several years, money invested in managed futures has more than doubled and is estimated to continue to grow in the coming years if hedge fund returns flatten and stocks underperform. (For more, see Money Management Matters In Futures Trading .)
The Profit Potential
One of the major arguments for diversifying into managed futures is their potential to lower portfolio risk. Such an argument is supported by many academic studies of the effects of combining traditional asset classes with alternative investments such as managed futures. Dr. John Lintner of Harvard University is perhaps the most cited for his research in this area.
Taken as an alternative investment class on its own, the managed-futures class has produced comparable returns in the decade before 2005. For example, between 1993 and 2002, managed futures had a compound average annual return of 6.9%, while for U.S. stocks (based on the S&P 500 total return index) the return was 9.3% and 9.5% for U.S. Treasury bonds (based on the Lehman Brothers long-term Treasury bond index). In terms of risk-adjusted returns. managed futures had the smaller drawdown (a term CTAs use to refer to the maximum peak-to-valley drop in an equities’ performance history) among the three groups between Jan 1980 and May 2003. During this period managed futures had a -15.7% maximum drawdown while the Nasdaq Composite Index had one of -75% and the S&P 500 stock index had one of -44.7%.
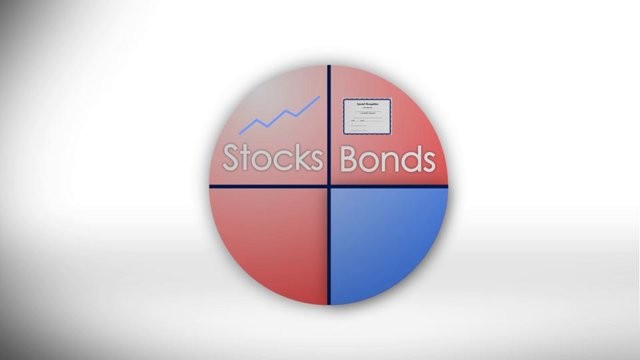
An additional benefit of managed futures includes risk reduction through portfolio diversification by means of negative correlation between asset groups. As an asset class, managed futures programs are largely inversely correlated with stocks and bonds. For example, during periods of inflationary pressure, investing in managed futures programs that track the metals markets (like gold and silver) or foreign currency futures can provide a substantial hedge to the damage such an environment can have on equities and bonds. In other words, if stocks and bonds underperform due to rising inflation concerns, certain managed futures programs might outperform in these same market conditions. Hence, combining managed futures with these other asset groups may optimize your allocation of investment capital. (Read Surveying Single Stock Futures for more information.)
Evaluating CTAs
Before investing in any asset class or with an individual money manager you should make some important assessments, and much of the information you need to do so can be found in the CTA’s disclosure document. Disclosure documents must be provided to you upon request even if you are still considering an investment with the CTA. The disclosure document will contain important information about the CTA’s trading plan and fees (which can vary substantially between CTAs, but generally are 2% for management and 20% for performance incentive).
Trading Program
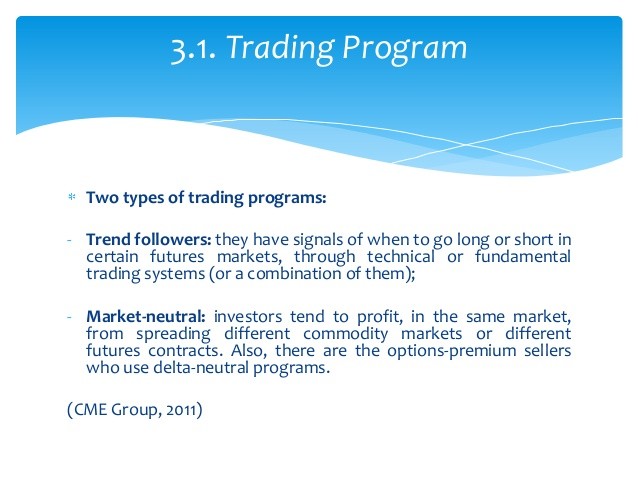
First, you will want to know about the type of trading program operated by the CTA. There are largely two types of trading programs among the CTA community. One group can be described as trend followers, while the other group is made up of market-neutral traders, which include options writers. Trend followers use proprietary technical or fundamental trading systems (or a combination of both), which provide signals of when to go long or short in certain futures markets. Market-neutral traders tend to look to profit from spreading different commodity markets (or different futures contracts in the same market). Also in the market-neutral category, in a special niche market, there are the options-premium sellers who use delta-neutral programs. The spreaders and premium sellers aim to profit from non-directional trading strategies.
Drawdowns
Whatever type of CTA, perhaps the most important piece of information to look for in a CTA’s disclosure document is the maximum peak-to-valley drawdown. This represents the money manager’s largest cumulative decline in equity or of a trading account. This worst-case historical loss, however, does not mean drawdowns will remain the same in the future. But it does provide a framework for assessing risk based on past performance during a specific period, and it shows how long it took for the CTA to make back those losses. Obviously, the shorter the time required to recover from a drawdown the better the performance profile. Regardless of how long, CTAs are allowed to assess incentive fees only on new net profits (that is, they must clear what is known in the industry as the previous equity high watermark before charging additional incentive fees).
Annualized Rate of Return
Another factor you want to look at is the annualized rate of return, which is required to be presented always as net of fees and trading costs. These performance numbers are provided in the disclosure document, but may not represent the most recent month of trading. CTAs must update their disclosure document no later than every nine months, but if the performance is not up to date in the disclosure document, you can request information on the most recent performance, which the CTA should make available. You would especially want to know, for example, if there have been any substantial drawdowns that are not showing in the most recent version of the disclosure document.

Risk-Adjusted Return
If after determining the type of trading program (i.e. trend-following or market-neutral), what markets the CTA trades and the potential reward given past performance (by means of annualized return and maximum peak-to-valley drawdown in equity), you would like to get more formal about assessing risk, you can use some simple formulas to make better comparisons between CTAs. Fortunately, the NFA requires CTAs to use standardized performance capsules in their disclosure documents, which is the data used by most of the tracking services, so it’s easy to make comparisons.
The most important measure you should compare is return on a risk-adjusted basis. For example, a CTA with an annualized rate of return of 30% might look better than one with 10%, but such a comparison may be deceiving if they have radically different dispersion of losses. The CTA program with the 30% annual return may have average drawdowns of -30% per year, while the CTA program with the 10% annual returns may have average drawdowns of only -2%. This means the risk required to obtain the respective returns is quite different: the 10%-return program with a 10% return has a return-to-drawdown ratio (see Calmar Ratio ) of 5, while the other has ratio of one. The first therefore has an overall better risk-reward profile.
Dispersion. or the distance of monthly and annual performance from a mean or average level, is a typical basis for evaluating CTA returns. Many CTA tracking-data services provide these numbers for easy comparison. They also provide other risk-adjusted return data, such as the Sharpe and Calmar Ratios. The first looks at annual rates of return (minus the risk-free rate of interest ) in terms of annualized standard deviation of returns. And the second looks at annual rates of return in terms of maximum peak-to-valley equity drawdown. Alpha coefficients, furthermore, can be used to compare performance in relation to certain standard benchmarks, like the S&P 500. (Read S&P 500 Options On Futures: Profiting From Time-Value Decay for more in-depth information.)
Types of Accounts Required to Invest in a CTA
Unlike investors in a hedge fund, investors in CTAs have the advantage of opening their own accounts and having the ability to view all the trading that occurs on a daily basis. Typically, a CTA will work with a particular futures clearing merchant (FCM) and does not receive commissions. In fact, it is important to make sure that the CTA you are considering does not share commissions from his or her trading program — this might pose certain potential CTA conflicts of interest. As for minimum account sizes, they can range dramatically across CTAs, from as low as $25,000 to as high as $5,000,000 for some very successful CTAs. Generally, though, you find most CTAs requiring a minimum between $50,000 and $250,000.
The Bottom Line
Being armed with more information never hurts, and it may help your avoid investing in CTA programs that don’t fit your investment objectives or your risk tolerance, an important consideration before investing with any money manager. Given the proper due diligence about investment risk, however, managed futures can provide a viable alternative investment vehicle for small investors looking to diversify their portfolios and thus spread their risk. So if you are searching for potential ways to enhance risk-adjusted returns, managed futures may be your next best place to take a serious look.
If you’d like to find out more, the two most important objective sources of information about CTAs and their registration history are the NFA’s website and the U.S. CFTC’s website. The NFA provides registration and compliance histories for each CTA, and the CFTC provides additional information concerning legal actions against non-compliant CTAs.


