A Look at an EquityIndexed Annuity
Post on: 16 Март, 2015 No Comment

A Look at an Equity-Indexed Annuity
By JLP | September 13, 2007
After writing yesterdays post on seminars . I decided to build a spreadsheet to analyze an equity-indexed annuity similar to the one my dad told me about. Now, it is important to note that there are LOTS of varaibles involved with annuities (particularly equity-indexed annuities). My illustration assumes something called a one year point-to-point, meaning that the account value is based on the performance of the index over a one year period. Other EIAs might have a monthly point-to-point.
Here are the assumptions I made when putting this spreadsheet together:
1. The annual EIA growth is capped at 10%, with a 100% participation rate. This means that the annuity holder gets 100% of anything up to 10% rate of return. So, if the annuity returns 7% one year, you get 7%. If it returns 12%, you get 10% due to the cap. Im almost certain that my assumption favors the EIA.
2. I assumed that the guarantee was no loss of principal. So, if the index returned -5%, the account had a 0% rate of return for that year.
3. I used the S&P 500 Index total returns for 1950 2006 as my foundation for the illustration. For comparisons sake with the EIA, I assumed an account that earned the S&P 500 Indexs return minus a 1.50% management fee. I also did not include any fees on the EIA, which again favors the annuity.
4. I left out taxes completely. Well assume that the non-annuity account is held in an IRA.
I have asked my dad to get a copy of the annuitys prospectus. Once I get that, Ill do an even more detailed analysis and post about it later.
Click to see larger image
Okay, here are the results I found after running my numbers:
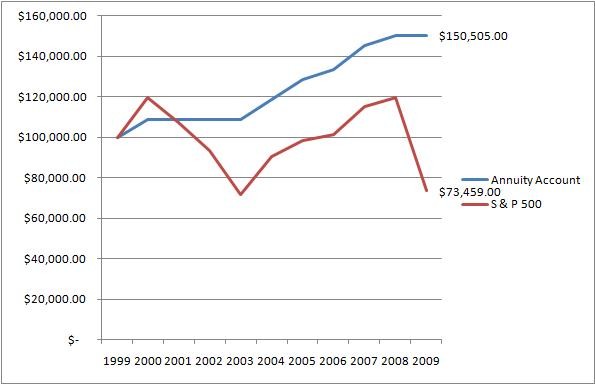
The hypothetical growth of a $1,000 investment in 1950 in the EIA would have grown to $42,670, for an average annual rate of return of 6.81%. The non-annuity account would have grown to $292,674 over the same periodan average annual rate of return of 10.48%. So the stability of the EIA cost $250,000! OUCH!
Why is the EIAs performance so pathetic? Heres why:

1. The EIAs annual return is capped at 10%. Over the 57-year period in the example, 34 years (59.6% of the time) had returns greater than 10%. Each of those 34 years, the rate of return was capped at 10%.
2. Over that same period, only 13 years had negative returns. In other words, the guarantee didnt really help out that much. Oh, and remember that there were no fees taken out of the EIA. So, you may not have lost money that particular year, but you would have still had to pay your fees.
If you are interested, you can download the spreadsheet I put together.
I would stay away from this EIA! I bet you the presenter of the seminar my dad went to did not go into this much detail!
Like I said, this is only an example to illustrate the EIA concept. There are many different kinds of EIAs (some are better than others) with many different features. Trying to sort through all the details is very confusing and nearly impossible to do a side-by-side comparison.
Note to any EIA salespeople: If I have misrepresented the EIA, please let me know (nicely). It is my goal to educate, not misrepresent.
UPDATE: Here are some follow-up posts on this topic. Please read them before you leave any comments.


