Volatility Index (VIX) Signals Danger For Stocks
Post on: 11 Август, 2015 No Comment

Heres a question for you. Whats so special about a chart signal when one line crosses above another line?
The answer is not much Except when it occurs on the marketss Volatility Index (VIX) also known as the Fear index.
Whenever this signal has occurred on the VIX fear index in the past 6 years, the stock market made a nasty decline or correction soon after.
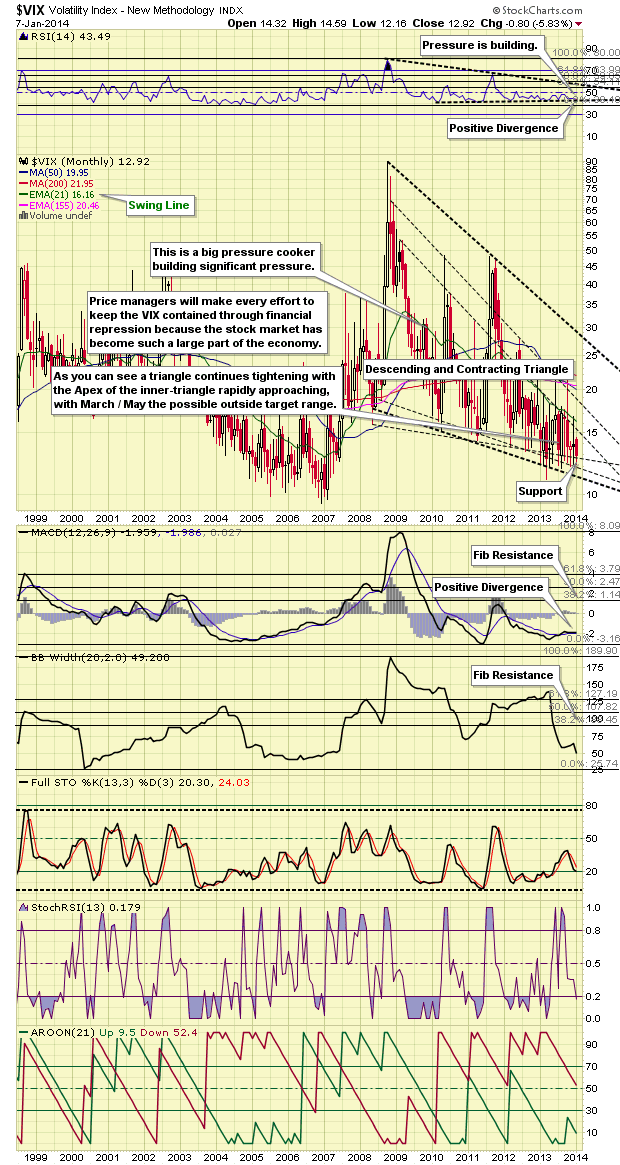
Take a look at this chart of the VIX and see what is about to happen now:
Notice the green arrows in the above chart. Each green arrow shows when the 20 week moving average (blue) crossed above the 50 week moving average (red).
Notice that we are about to have a similar signal right now in June 2013.
There were 4 signals in total in the past 6 years: in June 2007, in September 2008 (remember Lehman Brothers collapse?), in May 2010 and finally in July 2011.
Now take a look at what happened to the stock market immediately afterwards:
Each signal on the VIX preceded a major sell-off or correction in stocks.
The most prominent signal of course was in September 2008, just before the major crash in stocks that year. Three years later in 2011, the same signal produced a 20% decline in stocks.
What is important to appreciate about this signal on the VIX, is that the danger to the stock market was immediate and sudden.
According to sentiment reports, it took an average of 10 trading days for the VIX to peak after the signal occurred, during which the VIX rose by another 33% .
This means we could be in store for some ugly weather in stocks during the next two weeks. It also presents us with a great trading opportunity.
So here is my plan for this week and the coming weeks ahead. Take a look at this chart of the S&P 500 futures (ES):
Traders who want to take advantage of this fresh volatility in the markets can look to short any rallies back to 1592 or 1600 on the S&P futures. Shorting pullbacks to the 8 day moving average (the magenta line in the chart) is also OK.
On the Dow any pullback to the 14787 and 14876 range are also good shorting opportunities.
I am using a wide stop to counter the volatility. For S&P a stop above the recent highs at 1649 and for the Dow just above 15278 is acceptable.
The next important level for the S&P and the Dow to test is the 200 moving average (shown in green on the chart). This level is observed by many market players including hedge funds and mutual funds.
Once we reach the 200 moving average at the 1500 level on the S&P, I am looking to get interested on the long side. It does NOT mean I will necessarily buy at that level, but I want to see how the market will act near that zone (whether it will hold the market or not).
I still remain long term bullish on stocks. However, I do expect a correction in the short term and Ive been short on stocks since the later part of May.
For daily updates on stocks try our trade alerts here .
Alessio Rastani is a stock market trader at www.leadingtrader.com.


