Using momentum analysis to predict price change
Post on: 4 Август, 2015 No Comment

Trading has many big questions, and one of the biggest is this: When a market is moving in a particular direction, is it more likely to keep moving in that direction, or is it poised to exhaust its momentum and turn or stall?
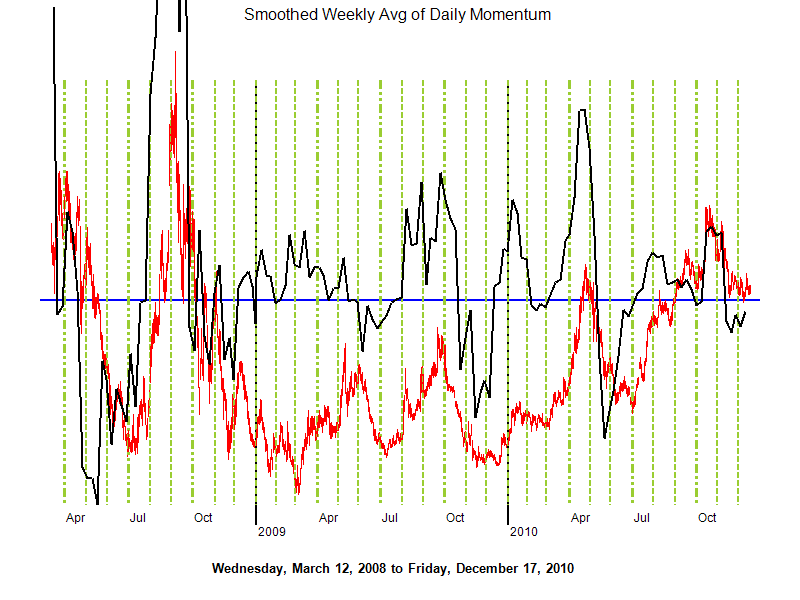
Momentum indicators, which measure the velocity of price changes and not necessarily the direction of price changes, dare traders to ask themselves that question constantly. That is, when the momentum indicator reports that prices are moving higher at an exceedingly faster rate, do you buy to go with the flow, or do you offset your longs or even sell on the assumption the market cant maintain such a high rate of change?
These indicators are typically displayed as oscillating lines beneath a price chart. As such, they often are referred to, in general, as oscillators. For most oscillators, positive values reflect rising prices and negative values reflect falling prices. The higher the positive value, the faster price is rising. The lower the negative value, the faster price is falling. Values near zero indicate the market is stagnant.
There are dozens of momentum indicators. However, they are all similar, with minor tweaks or twists. If youre new to them, however, its sufficient to start with three: rate of change, stochastics and the relative strength index (RSI).
THE INDICATORS
It seems passe to bother with indicator formulas more than two decades after the advent of modern technical analysis software. Nevertheless, seeing the mechanics behind the squiggly lines on the chart can offer insight that you might not otherwise have.
Rate of change (ROC) charts the close of the current period (minute, hour, day, week, etc.) as a percentage of the close a specified number of periods ago. An alternate calculation reports rate of change in percentage terms, dividing the difference between the two closes by the earlier of the two closes.
Here are the formulas:
ROC = (close_1 / close_n) * 100
ROC = ((close_1 close_n) / close_n) * 100
Reading the result of the formula is relatively simple. If the value on the oscillator is above 100%, this periods close is greater than the close n periods ago. If the rate-of-change value is less than 100%, this periods close is less than the close n periods ago. The extent to which the reading is higher or lower than 100%, the stronger the trend.
The relative strength index (RSI) was introduced by J. Welles Wilder in the June 1978 issue of Commodities magazine (now Futures) and was expanded on in Wilders book New Concepts in Technical Trading Systems, published that same year. RSI has since become one of the most popular technical indicators in use today.
According to Wilders original Futures article:
RSI = 100 — 100 / 1 + RS, where
RS = Average of 14 days that closed up / Average of 14 days that closed down
In calculating the index, you start with 15 days of price data (not just 14 because the first day requires the previous close from which to determine the first up or down close value). Add up the amounts by which the market closed higher than the previous day and divide that by 14. Do the same with the amounts by which the market closed lower. Divide the average up close by the average down close to get RS. For example, if the sum of the days up closes divided by 14 is 0.95 and the sum of the days down closes divided by 14 is 0.33, RS is 2.9, and:
RSI = 100 — 100 / 1 + 2.9
RSI = 100 — 100 / 3.9
RSI = 100 — 25.6
RSI = 74.4
The RSI value for the next day, day 16, is calculated by multiplying the previous average up and down closes by 13, adding either the new up close or the new down close, and dividing each value by 14. This effectively smoothes the oscillator, reducing noise.

Stochastics is visually unique from ROC and RSI. Stochastics, developed by George Lane in the 1960s, uses multiple lines to determine momentum. It measures a markets most recent close relative to its price range over a specified period. Stochastics is based on the idea that as a market tops, closes will be closer to the high of the price range over a recent time period, and as a market bottoms, closes will be closer to the low of that price range.
There are three values for stochastics, the first of which usually is omitted from charts but is necessary to calculate the second and third values. Raw K is the base of the indicator. The other values are smoothed versions of Raw K: %K is a moving average of Raw K, and %D is a moving average of %K.
The formulas for a nine-day stochastics oscillator is:
Raw K = 100 ((close_1 low_9) / (high_9 low_9)), where
Close_1 = current periods close
High_9 = nine-day high
Low_9 = nine-day low
%K = %Kt-1 + (0.5 (Raw K — %Kt-1))
%D = %Dt-1 + (0.5 (%K — %Dt-1))
Note: 0.5 is a smoothing constant derived from the formula 2 / (Z + 1), where Z is the number of periods used for smoothing, in this case 3.
The formulas for calculating %K and %D are simply exponential moving averages of Raw K and %K, respectively. There are other ways to calculate %K and %D, but the concept remains the same: The two are smoothed, less noisy and, presumably, more useful versions of Raw K.


