Use the ADX Indicator to Find Price Breakouts with Bitcoin CFDs (or other Assets)
Post on: 16 Март, 2015 No Comment

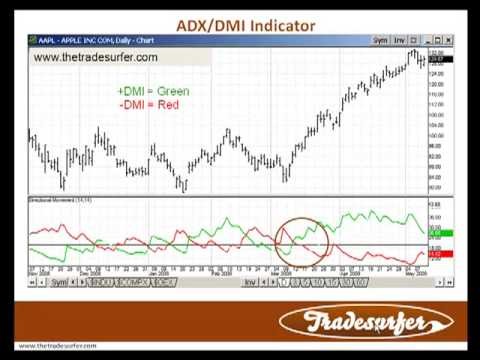
The ADX, also known as the Average Directional Index is a popular TA indicator which shows the strength. not the direction of a trend in a market.
The ADX (and other indicators) can be used with trend based trading strategies (like short-term momentum scalping ). to predict a trends strength and direction, then buy or sell when a price breakout is likely to occur.
The ADX may also be used to find areas of accumuation before price pops.
The ADX can also be combined with other TA indicators like the RSI. MACD . and Fibonacci Lines. to determine trends (both short and long-term), over and under-sold conditions, and find entry/exit points for ANY market.
The ADX values below may indicate the strength of a trend. ADX readings below indicate the following :
1 Weak Trend (0-25)
2 Developing Trend (25-50)
3 Strong Trend (50-75)
4 Extremely Strong Trend (75-100)
The ADX can also be combined with indicators like the MACD. (which shows the direction of a trend and price momentum) to find entry/exit points before price breakouts.
What do ADX trend numbers mean?
The ADX helps traders find weak trends (indicated by ADX values of 0 25) and areas of accumulation.
If a weak trend occurs over a period of 30 bars it may signal a period of accumulation or distribution .
What is Accumulation and Distribution?
Accumulation this is a period of buying, which traders reinvest profits into their portfolio. Traders can use the A/D line to show buying/selling pressure which confirms trends in a market as well as potential reversals in the trend .
Distribution periods of distribution occur when selling pressure is building. If the A/D line is falling, selling pressure may be accumulating, even if the price is rising.
Determining the Momentum of ANY Trend
The ADX shows values between 0 100 and indicates MOMENTUM of any assets price. It ALSO signals whether a trend is strengthening or weakening .
The ADX can be combined with a Momentum Based Trading-Strategy. so traders can profit from short or long term trends in ANY market. Some consider the ADX to be a rare leading-indicator which can help traders find price breakouts .
A series of higher peaks in the ADX can signal an uptrend and increasing price momentum, while a series of lower peaks might signal a downtrend and weakening price momentum.
If the price momentum is increasing. the price of an asset may continue to rise until it breaks out of its current price channel into a NEW price channel .
How is the ADX calculated?
The ADX can find trend strength and price momentum with ANY type of asset. The ADX is shown as a plotted line which will range in value from 0 100 .
The ADX does NOT show the direction of the overall trend, ONLY the strength. It does not matter whether the ADX is closer to 0 or closer to 100.
If the ADX is above 25. it indicates an emerging strong trend. A value of 25+ may be strong enough for a trend trading strategy, including short-term momentum scalping .
On the other hand, if the ADX is below 25, there may NOT be a strong enough trend to use a trend-based strategy .
If an ADX is low (between 0 -25). the price will eventually rise/fall and break into a NEW trend.
When the ADX is rising. it shows that the strength of a trend is increasing . If the ADX line is falling. it DOES NOT indicate that the trend is reversing. It just means that the strength of the trend is weakening .

What TA Indicators are combined with the ADX?
Additional TA indicators like the RSI, MACD. and Fibonacci Lines can be combined with the ADX (average directional index) to confirm trend signals and provide entry/exit points .
The RSI (relative strength index) can indicate over-bought or over-sold conditions. It can also be combined with the ADX and a trend-based strategy to profit from emerging up and down-trends.
The RSI may also be helpful when the ADX shows an emerging weak trend or decline in the strength of a trend .
In this case, we can use the RSI to help us buy in BEFORE a PRICE breakout or decline, BEFORE a new price trend occurs.
ADX Indicator Signals for a Long Entry
The ADX works by showing signals of increased/decreased trend strength and volatility in a market. We can use these signals to find entry/exit points BEFORE a new trend forms.
The ADX is very effective at showing volatility. Since volatility often leads to the formation of new trends and price breakouts, some feel that it can be used as an uncommon LEADING INDICATOR .
Indicators for Entry (long) rising 20-bar MA (moving average). a good entry point would be if the 14 bar RSI is 85 or less. We would also want the ADX to exhibit an emerging or strong trend, because we are expecting the price to continue to rise.
If the ADX is flat. enter when the 14-bar RSI is 50 or less.
The MACD and the ADX
Once youve identified an uptrend, the MACD (moving average convergence divergence) can be combined with the ADX indicator. to find buy signals and entry points.
When the 12-period EMA crosses over the 26-period EMA. a buy signal is generated. An MACD crossover with a rising ADX may indicate a strong trend leading to a potential breakout.
Let me know if you test any ADX indicator strategies, contact me @CfdTradingBlog on Twitter


