Understanding the Accumulative Swing Index and the McClellan Oscillator
Post on: 3 Апрель, 2015 No Comment

Understanding the Accumulative Swing Index and the McClellan Oscillator 5.00 / 5 (100.00%) 1 vote
When beginning traders start to get comfortable with their field, it is important for them to begin broadening their horizons in terms of what indicators they can use for their investments. Familiarizing yourself with a variety of different trend indicators and analyses will ensure that you have the opportunity to excel in your trades no matter what the situation. Two of the most useful and versatile types of indicators that you can use are known as the accumulative swing index and the McClellan oscillator. Both of the indicators can be used in different situations, and learning how well they can be utilized is an important part of working with successful results.
The accumulation swing index, which is abbreviated as ASI is understood to be a variation of the commonly known Welles Wilders swing index. When it is plotted, a total of the swing indexs value will be established for each bar. The swing values index is based on a value from zero to one hundred for up bars, and zero to negative one hundred for down bars. The swing index will then be calculated when the trader uses the current bars high, low, open, and close, in addition to these values in the previous bar. This type of index is a very popular analysis tool used by traders in futures markets. This indicator can be used to understand the long term picture of certain contracts in a broader and better scope. If you determine that the long term trend is moving up, then the accumulative swing index will have a positive value. The opposite is true in downward trends, and sideways values can also be used to note fluctuations between different values.

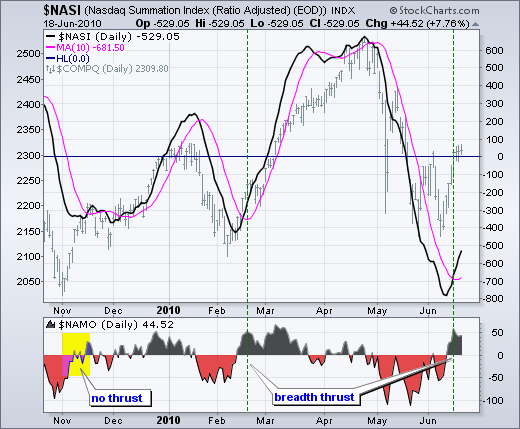
The McClellan Oscillator, which was developed by Marian and Sherman McClellan in the 1960s, calculates averages between two exponential moving averages, focusing on the declines and advances in the same day period. It works by using these differences and averages in order to help gauge market breadth. In order to plot with this device accurately, charts will need to contain declining and advancing issues, with inputs that can specify the right data for each. Because this device works with exponential averages, numerical values will depend on data as it appears in the chart, so it is crucial to make sure that all of the established information is accurate. If the stock market is rallying but there are more issues that are declining rather than advancing, then it may be possible that the rally is simply too narrow without the stock market participating.
Using the accumulative swing index and the McClellan oscillator, you will be able to better focus your trades in a positive direction, while keeping a better eye on trends overall. As with any such devices, however, it is important to familiarize yourself with raw values and never rely too heavily on any one technique during investments.


