Trading with Relative Strength Index
Post on: 16 Март, 2015 No Comment

J. Welles Wilder
RSI for short, Relative Strength Index is a technical analysis tool developed by J. Welles Wilder and was first published in his book, New Concepts in technical trading systems during 1978. Welles Wilder is attributed to many other technical indicators such as the Average True Range, Parabolic SAR and Average Directional Index.
Ever since its introduction, RSI has become one of the most important and commonly used indicator as part of a larger trading system or strategy. Due to its importance, the RSI indicator is available by default on most trading platforms or charting packages.
The RSI indicator is a momentum indicator. The concept of momentum in trading is based on the principle that trends are usually followed by momentum. Higher the momentum, the more trending the markets tend to be and vice versa. Therefore, the RSI compares the magnitude of recent gains to losses and helps determine overbought and oversold conditions.
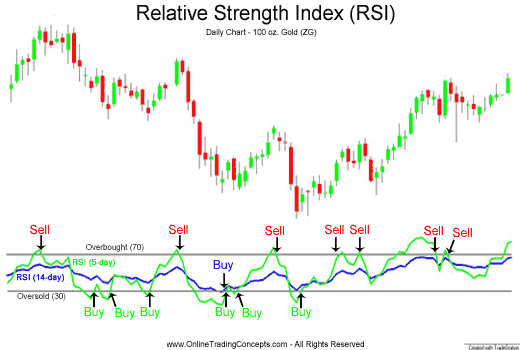
Working as an oscillator, the Relative Strength Index is plotted by the RSI line against key levels of 25 and 75 (or 70 and 30). When the RSI reaches above the 75 level it is thought that the market is in overbought state and thus price should start to move downwards, and vice versa when RSI reaches below 25 or 30.
Constructing the RSI Indicator
The RSI Indicator (oscillator) is derived by a moving average for a specified period of time. The default setting for RSI is 14 periods. But other commonly used parameters include 7, 5 and even 3. The RSI works across all time frames of the chart. However, the smaller the setting, the more sensitive the RSI indicator becomes, thus potentially signalling false market conditions.
Relative Strength Index Momentum Oscillator
Trading the RSI Oscillator
There are many different ways to trade the RSI oscillator. The most simplest of these being buying when RSI is below 25 and pointing upwards (indicating a rise in prices) and selling when the RSI is above 75 or 80 and pointing downwards, indicating a down trend in the markets.
Another commonly used way to trade RSI is divergence. Meaning that when RSI plots higher highs whereas the price makes lower lows. Divergence is usually associated with a change in the direction of the trend.
When using the RSI, the ideal way to use this indicator is when combined with other indicators, especially ones that track the trends. Using the RSI this way makes it possible to enter existing trends, such as buying on dips while in an uptrend.


