Trading Volatility (VIX)
Post on: 18 Июль, 2015 No Comment

The volatility of the markets is always varying, and depends on how secure or scared the market participants are. Sometimes you want high volatility, such as when you are looking for a large move in a price, and sometimes low volatility will help you sleep better at night, for instance when you look at your long-term investments and savings. It used to be that volatility just was, and you accepted that. Since 1993 however, the Chicago Board Options Exchange has been tracking volatility, and calling the measure of it the VIX.
The Chicago Board of Options Exchange Volatility Index (VIX) is used as a measure of the implied volatility of S&P 500 index options. The VIX is an index which measures volatility in real time in the stock market, specifically the S&P 500, Americas benchmark stock market index which tracks the price of the 500 largest listed companies in the United States. It is based on S&P 500 index options on the Chicago Board Options Exchange. The VIX, sometimes referred to as the ‘fear index’ is really a measure of how much stock market traders are expecting the S&P 500 to move, both up and down, over the next 30 days. A high index value would suggest more market volatility based on the higher price of options. Note that the VIX is not the the S&P 500 index; it is best to think of it simply as the level of fear and uncertainty in the market. It is also important to note that the Volatility Index is a measure of volatility in either direction, i.e. the upside as well as the downside.
While it was interesting to see how the volatility varied, it originally was not possible to trade directly on the VIX, which CBOE calculated from the option prices on the market. The VIX is actually the ‘implied volatility’, that is, it is worked out backwards from the traded prices, and for the VIX it is the prices on the S&P 500 index that matter. The Dow Jones Industrial Average is tracked by a volatility index called the VXD, and the NASDAQ 100 is followed by the VXN.
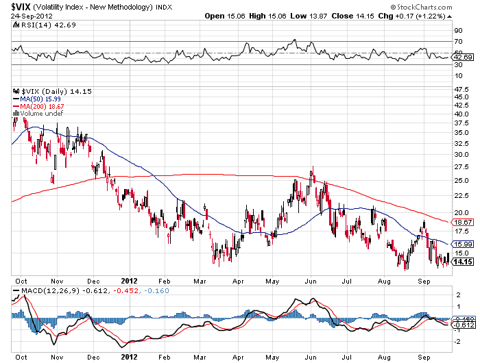
The VIX is a percentage, and the higher it is, the more volatile the market is perceived to be. In particular, the VIX goes up and down wildly when there is uncertainty in the market. Although the VIX only started being measured in 1993, it never broke above the 35 mark until the Russian debt crisis in 1998, and the subsequent dot.com crash. The Russian debt crisis brought a period of big swings in the index between 1998 and 2003, after which it settled down for a while. It historically has been between 15 and 35, but it shot up to 90% towards the end of 2008, past the 70 level, reflecting the crazy state of the markets following the collapse of Lehman Brothers. Likewise, last May (2010) the VIX moved sharply up from a level lower than 20 to a high of 45 during the markets sell-off.
The VIX, in this sense is a measure of the level of fear and uncertainty in the market. This is usually investor fear about the effect of bad news on share prices, although it is possible that widespread optimism in the stock market could drive the VIX up too. A good rule of thumb is that values over 30% show a fair amount of investor uncertainty, and values under 20% show investor confidence and even complacency. Where it is in relation to its 10 day moving average has been found significant by Connors Research, who noted that if it was 5% or more above its SMA10, the S&P 500 performed twice as well as average. When 5% or more under the SMA10, the S&P 500 underperformed, at least for the following week.
In addition to futures and options on the VIX which have been introduced, you can now get a contract for difference (CFD) on the value of the VIX, and this represents the best way for many traders who want to take a direct conjecture on the direction that it will move. Some people even suggest that this can be used as a hedge for another existing position. The VIX really acts as if it is negatively correlated to the broad market, so it generally goes up when the market is falling, and falls when the market is increasing — according to the CBOE, this correlation is about 88% true.
Trading volatility is usually limited to short term trading, so it is important to keep abreast of any economic indicators that are to be released during the time frame you intend to trade in. For instance, the USA non-farm payroll figures are widely regarded as one of the most important indicator of how the USA economy is faring, so unexpected numbers here are likely to affect the market and level of volatility.
Keep in mind that the VIX is based on expectations of volatility in the market, not todays volatility. It is really a measure of how stock market markets expect the market to behave in the immediate future. CFD traders can compute the real volatility the market is forecasting from the S&P 500 by simply dividing the current VIX price by 12. If the VIX is at 22.28, then traders are expecting annualised volatility of around 1.8%.
Two notes about trading CFDs on the VIX. First be aware that volatility is not the equivalent of a downturn in the market and it is very much possible for the market to fall yet volatility remains subdued (although again a Vix reading below 20 has often been followed by a sell-off). This situation would happen if the markets were all moving in one direction and thus nobody is uncertain about what’s going to happen.
Secondly, the VIX is based on the nearest options, and is a 30 day measurement into the future. It does not take account of the longer view, as represented by the options that expire in two+ months. However, as the VIX is continually updated this mitigates the effect of the shorter term, and does allow you to trade on your views of volatility in a longer time frame.

Trading the VIX Index
If you are uncomfortable with short-selling or find it difficult to make money on the short side, the VIX index represents an interesting trading alternative at a time when many stock market indexes are going down. Many CFD providers will quote a price on the VIX and it is a good instrument to trade; when you believe that fear is likely to grip investors, or when you believe that their fears are unwarranted.
The negative correlation that exists between the stock markets and the VIX index means that investors can either use it as a hedge for their share portfolios or as a way to gain from higher volatility levels. If the VIX index is high, you might want to consider a short position on the VIX as a profit play as it comes down. This can easily be done with a CFD trading account, as CFDs allows you to profit from both falling and rising prices. A number of CFD providers offer futures contracts on the Volatility Index, including IG Markets. GFT and CMC Markets. all with fairly competitive spreads. GFT, for instance offer a spread of 0.10 basis points plus the underlying market spread with a margin requirement of just 1 per cent.
Keep in mind that the VIX index represents prices being paid for options, used by big market participants like hedge funds and banks to limit their downside risk, particularly for USA equities. If something frightens them, they will start buying options, and the options prices will move up as a consequence. When most market participants are scared and running for cover, you can look at the VIX as an index that might actually rise amidst all the negativity. Some sharp CFD traders even use the VIX as a cross-check before deciding to take a short position. Shorting allows you to make a gain on a financial instrument falling in value, but will it fall? Will the general market keep moving up? Here you can use the VIX as a reference for your short. Is the VIX index still moving up? Are the daily volumes increasing? This could be an indication that it is a good time to considering shorting some shares.
You can also trade options directly using CFDs since these are priced in part using implied volatility. To buy an option contract for difference you still have to pay a premium for the privilege (just as if you were buying a regular option) but this premium is the most that you could lose if the trade went against your position. Additionally, the premium cost goes down when volatility is very low so you can use this buy a CFD on a put option, which bets that the FTSE will be at 5,300 by June (at time of writing FTSE is 5,650) for about 100 points. You would thus only need the index to hit 5,200 — hardly unimaginable, — in order to make this trade a profitable one. And should the index end up being volatile but in the wrong direction, then you only lose your premium rather than the unlimited losses that a traditional CFD or spread bet would expose you to.
Note: Do realise that most CFD providers do not actually offer daily VIX or VIX based on the cash price. Most brokers will price their VIX futures contracts off the front month contract (ie. the closest future contract to the present date). For instance, today being the 1st February, IG Markets have Feb 11 and March 11 contracts only for the VIX. Volatility Index futures are usually quoted as monthly contracts. Positions that are left to expire will close based on the final settlement value of the Volatility Index futures as reported by CBOE on the day following the last trading day. The final settlement value is determined from a Special Opening Quotation (SOQ) of the index, which is calculated from the sequence of opening prices of the constituent SPX options.
Recommend this on Google


