Trading the Bullish Head Shoulders Pattern in Forex
Post on: 16 Март, 2015 No Comment

Learn to Trade this Classic Pattern with a Real-Time Example
Many traders are fans of reversal patterns because the risk to reward ratio is favorable. This means that because we don’t know the future, we should look to enter a trade at a level where we are closer to our exit than to our target level so that if you’re trade doesn’t work out, you’ve lost a relative small amount compared to the amount you’re looking to profit on the trade. A chart pattern that allows a clean risk: reward ratio is known as a head and shoulders pattern due to the way the chart resembles the outline of a person standing in front of or behind them as you can see.
How to Recognize a Bullish Head & Shoulders Pattern
There are two types of head and shoulders that you should be made aware. The most common is the bearish head and shoulders which is a topping pattern. The one we’ll discuss today is the bullish head and shoulders, which is bottoming pattern and presents a buying opportunity.
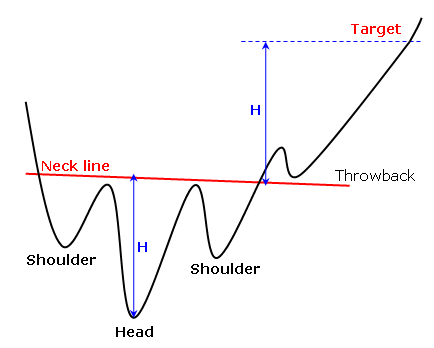
The way to recognize either pattern is a lonely thrust higher or lower surrounded by two weaker moves. The thrust higher is recognized as a head and the two weaker moves are the shoulders. After these three peaks of varying heights are recognized a trendline is drawn to help you identify a clean breakout known as a neckline. A neckline breakout is a tool to help you confirm that a tradeable move is underway and from there, your job is to decide where to place a stop and what price to target an exit should price move in your favor.
How to Trade a Bullish Head & Shoulders Pattern
Few patterns are as crystal clear as the head and shoulders whether it is a bullish or bearish pattern. The shoulders and head should be easy to define, which leads you to a neckline that helps you decide when the move has a higher probability of playing out. Once everything is labeled in the head and shoulders chart pattern like the chart above, you can then use the pattern itself to help you place stops and limits on the trade.
First, let’s discuss the where to place a stop because protecting your downside is always the most important component of any trade. When the stop is determined, you can then look to a price target to exit at a profit and determine if the risk: reward makes for a favorable trade.
Where to place the stop exit:
The most recent shoulder should provide a clean level to place a stop. This means in a bullish head and shoulders pattern similar to the GBPUSD chart attached, the stop would be below the right shoulder so that either a price spike or daily close below that level would exit the trade because the pattern isn’t as clean as we hoped it would be when we entered the trade.
Where to place the profit target:
The profit target may seem odd if you’re unfamiliar with the pattern but its very simple to determine for new and experienced traders alike. The first thing you need to do is identify the head of the pattern whether it’s a bullish or bearish pattern. Secondly, draw the neckline by drawing a trendline that connects the two peaks in a bullish head and shoulders pattern (attached chart) or two troughs in a bearish head and shoulders pattern and determine the price distance from the neckline to the price extreme within the head. Lastly, you can extrapolate that price distance from the breakout point of the neckline to give you a price target or limit.
Putting it all together:
Trading the head and shoulders pattern is simple and beneficial because the risk and reward levels are very easy to identify. If you decide to trade the pattern, please make sure that you manage your trade size so as to not over-leverage. You can never tell before the fact whether or not the pattern will play out as we hope it will.


