The Commodity Channel Index
Post on: 22 Май, 2015 No Comment

Posted on10.01.2011
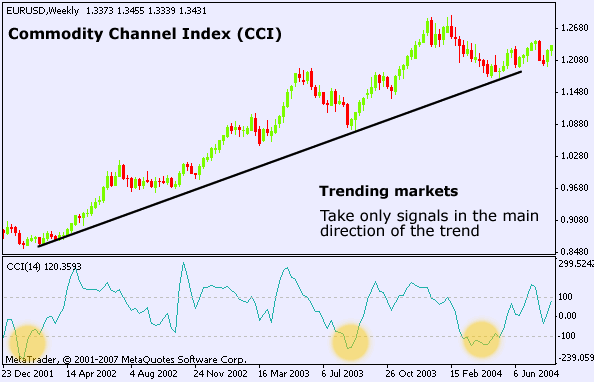
One widely available and little understood oscillator is the commodity channel index (CCI). Introduced by trader Donald Lambert in the October 1980 issue of Futures (then Commodities ) magazine, the CCI can be widely used in other varieties of securities trading, including share trading, as well as the commodities markets.
Without going into the details of the mathematics, the CCI compares the difference between the average share price and its moving average, both calculated over a particular lookback period, to the share price’s deviation from that average. The result is graphed in a standard oscillator format, a single line ranging across a positive and negative scale, in a lower indicator window.
The CCI is particularly useful for identifying cyclical trends. Although it’s generally preloaded with a lookback of 20 time periods, it can be easily customised for individual securities. To do so, the trader should note the interval in days between the highest highs or lowest lows on a stock’s yearly chart, known as the cycle length or duration, and divide that figure by three.
Here’s the Bank of Queensland (BOQ) current daily chart, with the CCI using the 20-day lookback:
And here’s the same chart with a 61-day lookback, a figure selected using the cycle timing method:

Each chart has advantages and disadvantages. The cycle-timed indicator follows more precisely the moves of the share price. However, the 20-day lookback indicator shows an excellent example of negative divergence, with the 7 December share price easily higher than the 5 and 11 November highs, while the CCI sets a lower high in December than in November. This is a clear selling signal, either for short-selling or closing an open long position, and it’s not provided by the cycle-timed CCI. As with most other aspects of technical trading, this is an individual decision that must be made by each trader.
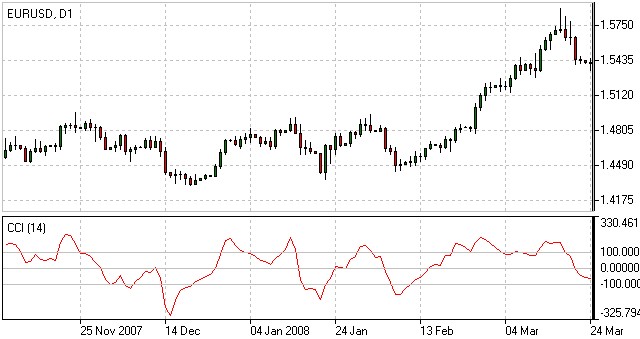
The CCI is used to identify overbought and oversold levels, same as other oscillators. Although the scale goes well beyond 100 and ?100, as the BOQ charts above demonstrate, anything above 100 is considered overbought and anything below ?100 is oversold. As well, the CCI illustrates reversals and provides buy and sell signals through positive and negative divergence:
- Positive divergence is a signal a short-term downtrend may be reversing. The price sets a lower low that’s not confirmed by the CCI, and
- Negative divergence shows an uptrend may be reversing, with the price setting a higher high that the CCI does not confirm.
All oscillators require confirmation prior to entering the trade. Good partners for the CCI include moving averages, pivot points, Fibonacci levels, and candlestick patterns. Pivot points, candlesticks, and Fib levels all indicate turning points in a trend and so can potentially support the findings of the CCI. Note that moving averages can serve as dynamic support and resistance levels, but must be tailored for each stock chart, as well.


