Ten Shocking ETF Charts From The Flash Crash
Post on: 24 Апрель, 2015 No Comment

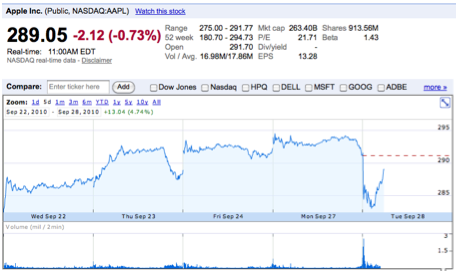
An already tumultuous day took a terrifying turn in afternoon trading on Thursday, as several major U.S. indexes lost multiple percentage points in a matter of minutes before reclaiming big chunks of the ground lost. At 2:40 on Thursday, the Dow Jones Industrial Average was down about 415 points, putting it on pace for one of its worst days of the year. But the worst was yet to come; by 2:47, just seven minutes later, the Dow had plummeted another 583 points, putting it down nearly 1,000 points for the day. In the next ten minutes, the Dow jumped more than 600 points; by 2:57 it was down only 388 points on the day.
The steep decline immediately sparked speculation on Wall Street. Anxiety had been building over the deteriorating situation in Greece, but there seemed to be more at work behind the sudden plunge (see Six ETFs To Watch As The Greek Drama Unfolds ). Traders immediately suspected that a market glitch had contributed to the severe dip and subsequent bounce, theorizing that high-frequency trading firms, which account for about two thirds of total trading volume, had played a part in the chaos.
The Securities and Exchange Commission and the Commodity Futures Trading Commission said they were working with other regulators to review unusual trading activity. Exchanges also said they were looking for trade glitches and considering canceling certain trades. News that several stocks, including Accenture and Boston Beer Co. had momentarily lost nearly all of their market valuetrading for just a pennyall but confirmed suspicions that something went seriously wrong behind the scenes on Thursday.
While the sudden plunge of these stocks was indeed bizarre, perhaps more interesting was the behavior of several ETFs during Thursday trading. Below, we present ten charts that tell a story of one of the wildest days ever on Wall Street (for more ETF insights, sign up for our free ETF newsletter ):
1. iShares Russell 1000 Growth Index Fund (IWF )
Want to see $11 billion disappear in a matter of seconds? Take a look at the chart below; IWF briefly traded for a penny yesterday.
Thursday Open: $51.42
Thursday Low: $0.01
Thursday Close: $50.11
2. iShares Dow Jones Select Dividend Index Fund (DVY )
DVY has assets of about $4.1 billion. On Thursday this ETF plunged about 63% intraday, before climbing 166% from its intraday low.
Thursday Open: $46.50
3. iShares S&P MidCap 400 Index Fund (IJH )
This popular mid cap ETF didnt see its $7.5 billion become completely worthless, but it did lose about 84% of its value at one point on Thursday. IJH then gained nearly 500%, rising from about $13 to close above $77.
Thursday Open: $79.76
4. iShares S&P SmallCap 600 Index Fund (IJR )
This small cap ETF, which has about $6.4 billion in assets, lost more than half of its value on Thursday.
Thursday Open: $61.21
5. iShares S&P 500 Index Fund (IVV )

A 25% drop in the S&P 500 ETF seems impossible (or a certain sign of the apocalypse), but it happened in Thursdays trading; IVV lost 24.2% before spiking to finish the day down about 3%.
Thursday Open: $116.64
6. iShares S&P 500 Growth Index Fund (IVW )
Thursday Open: $59.19
7. iShares Russell 1000 Value Index Fund (IWD )
8. iShares Russell Midcap Index Fund (IWR )
This mid cap ETF also lost more than 99% of its value on Thursday, bottoming out at 13 cents during the market glitch.
9. Vanguard Total Stock Market ETF (VTI )
It wasnt just iShares ETFs that sunk on Thursday; this This mid cap ETF also lost more than 99% of its value on Thursday, bottoming out at 13 cents during the market glitch.
Thursday Open: $59.46


