TechniTrader® Candlestick Charts Stock Price Action
Post on: 16 Апрель, 2015 No Comment

Candlestick Charts Training — Free!
Are you looking for an effective way to use candlesticks in your trading? You’ve found the right place. We teach candlestick patterns that make sense and that help you understand how a stock’s price will move next.
Our method of candlestick charting for trading decisions is different from what you will find anywhere else. After you watch this video. click the video icon below to sign up to watch the free Candlestick Charts Training Video and gain access to the entire free training library at TechniTrader.com.
Watch Candlestick Training Video
All trading instruments, from option contracts to futures and Forex, can use candlestick charting to plot and follow price action and to plan exits and entries. Candlestick Charts provide the most graphical view of what is going on with price. Since every transaction, no matter how small or how large, is recorded and documented, it is possible to make a precise & highly accurate recording of how price moves over various periods of time.
Candlestick charts are the oldest form of charting, but their use in western markets is relatively new. They were introduced in the early 1990’s just as the online brokers for retail traders and investors came to market. The term candle comes from the Japanese, who created this form of charting for their rice commodity exchange during the 1600’s. The candlesticks on the chart look like real candles of that era, hence the name. Although we must modify how we interpret candlestick patterns for our western automated marketplace, these charts are far superior to any other form of charting at this time.
Candlesticks are the most used charting today and are used by most retail traders and investors for trading in stocks, options, forex, futures, commodities and ETFs. They can also be used on major indexes, industry indexes, etc. Candlestick charts are far easier to read and provide more information than a bar, line, P&F, Kagi, or other non-candlestick charts.
But for most people who are just starting to learn about investing on their own, the task may seem daunting as there are so many different candle patterns all having strange, Japanese names. Then too, most candlestick books offer complicated methods and confusing explanations that can frustrate the average trader.
Candlesticks Make Reading Stock Charts Easy
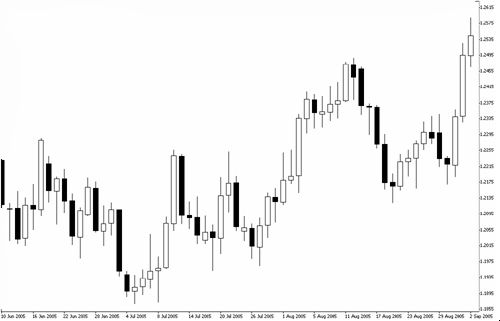
Candlestick charts have the same data as a bar chart but the candlestick representation of price activity makes it far easier to see what price has done in a day, 5-minute period, or a week. This speeds up the analysis dramatically and eliminates common errors and mistakes that occur when you use bar charts. When you have your candlestick chart set to black and white, the candles turn black on a down day and white on up day. This immediately tells you whether the stock moved up that day or down, AND the candles show you how much it moved.

Very long candles tell you the stock price moved several points. Small candles tell you that the stock didn’t move much.
By studying the relationship and the different kinds of candlestick patterns that form, traders can learn to reliably determine what the stock will do over the next few days to few weeks. This is why candlestick charts have become so popular so quickly.
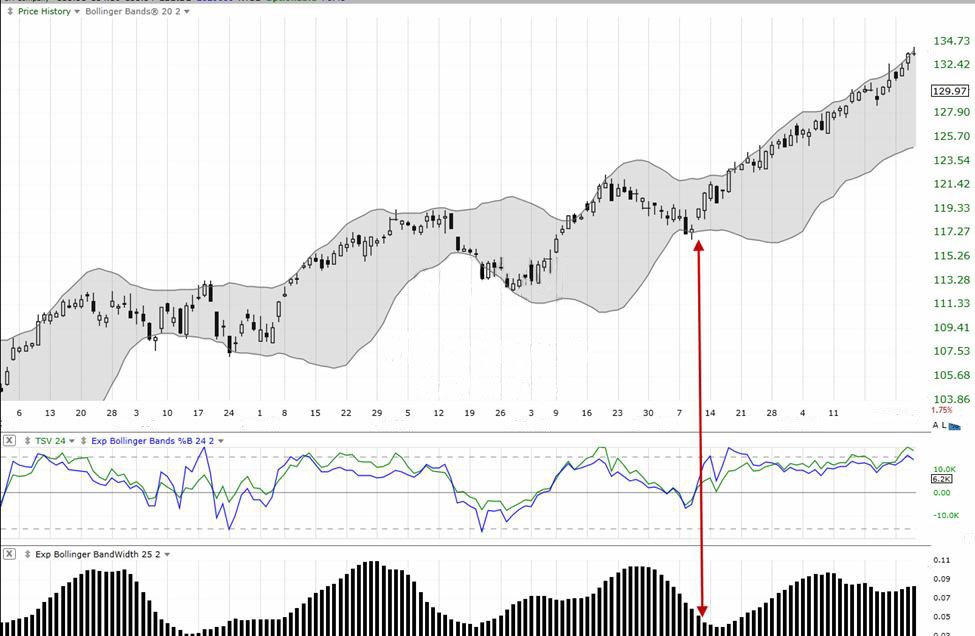
Below is a candlestick buy signal that only TechniTrader teaches. It is called the springboard and it occurs often in lower priced stocks poised to move up quickly. It is a very reliable candlestick buy signal based on a group of candles forming in a specific way. The volume and institutional accumulation indicators-the bars below confirm there is sufficient energy and buying activity behind the price to move it up for good swing trade profits.


