Support and Resistance Price Levels
Post on: 16 Март, 2015 No Comment

Learning to recognize support and resistance price levels on stock charts can help improve your ability to forecast future price movements. Scalping, Day Trading, Swing Trading and Long Term Investing styles can all benefit from an understanding of this topic.
These price levels are determined by points at which supply and demand equalize and then reverse.
During a rise in price, demand increases from buyers more than the supply available from sellers.
During a decline in price, the supply increases from sellers more than the available demand from buyers.
Often times you will see prices move slightly beyond previous support and resistance levels only to reverse, catching some traders off guard.
Here are some other pages I have to learn about Technical Analysis:
Support Level
This is formed at a price level where the number of Buyers willing to step in and buy is greater than the supply available from sellers willing to sell. In a declining stock, this causes a temporary floor in the declining price and a reversal move higher.
If the supply available from sellers increases at a support level, a further decline is possible and a new support level further down must be looked for.
A move through a support level lower is considered a breakdown, or a breakout move lower. Just because a price moves through a support level does not mean it will continue moving lower though. Sometimes you will see a fakeout, or a Bear Trap, in which the price will move lower a little, only to reverse and move higher again.
Resistance Level
This is formed at a price level where the supply available from sellers willing to sell is greater then the demand from buyers willing to step in and buy. In a rising stock, this causes a temporary ceiling in the rising stock price and a reversal move lower.
If the demand from buyers willing to buy increases at a resistance level, a further move higher is possible. This is known as a breakout, or breakout move higher and a new resistance level will have to be looked for above this price area.
Just because a stock moves higher through a resistance level, does not mean it will continue moving higher. Be careful that it does not quickly reverse as in a Bull Trap.
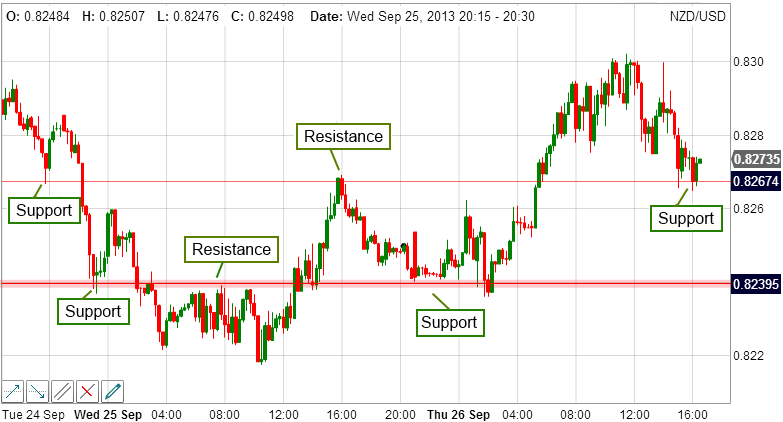
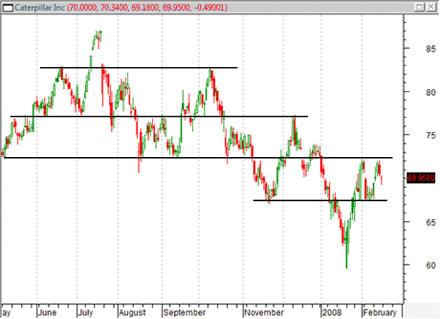
Take a look at the two example charts below. The first one is an example using a 5 day chart and the second example chart is using a longer time frame of a little more than 1 year. Notice on both charts that on several occasions there were moves through the support and resistance levels that didn’t last and wound up reversing.
By studying these and other chart examples you can come up with a stop loss strategy that will allow for some of these false breakouts so you don’t get out too early, and at the same time minimize losses if it is indeed a breakout.
Things to Consider

- Look at multiple charts using multiple time frames:
When looking for recognizable chart patterns, support and resistance levels and any type of Technical Analysis in general, I always look at multiple charts displaying several time frames. This helps me confirm levels I am considering.
For example, if I am looking at an intraday 1 minute chart and looking at $6.00 as a support level, I will look at a 2 day chart, 5 day chart and sometimes 10 day chart to see if that particular price level was support at any other times.
While it is not necessary for the same level to be seen on previous charts for me to enter a trade, if it was a previous support level it will strengthen and confirm my thoughts on using that particular level. If the price bounced off of it previously, there’s a higher probability that it will bounce again, rather than not.
Consider using a price range at support and resistance levels:
Just because a previous support level was at $6.00 doesn’t mean that a future bounce off of $5.90 or so should not be considered as holding the level. It is common to use a price range rather than an exact price point.
While exact price points do occur, technical analysis techniques are not an exact science and room for variations should be given.
Don’t forget to use a stop loss per your specific trading plan:
Always allow for the possibility of being wrong, it will happen. Consider using a stop loss just outside of the price range in case the trade goes against you.
When you have your stop loss in place, whether mentally or already set up with your trading program, stick to it. Don’t second guess yourself and move it around.


