Stock Intermarket Divergence Suggests Market Surprise
Post on: 24 Май, 2015 No Comment

FXCM Expo Videos (Innovative Tech. explains Key Reversals and RSI Signals)
December Key Reversals-none
December RSI Signals-CADCHF GBPCHF NZDCHF USDCHF (all bearish)
Key Reversals Last Week-EURGBP (bullish)
RSI Signals Last Week-AUDNZD (bullish) NZDJPY NZDCAD (bearish)
Daily Key Reversals (RV) and RSI Signals (RS)
Morning Comments:
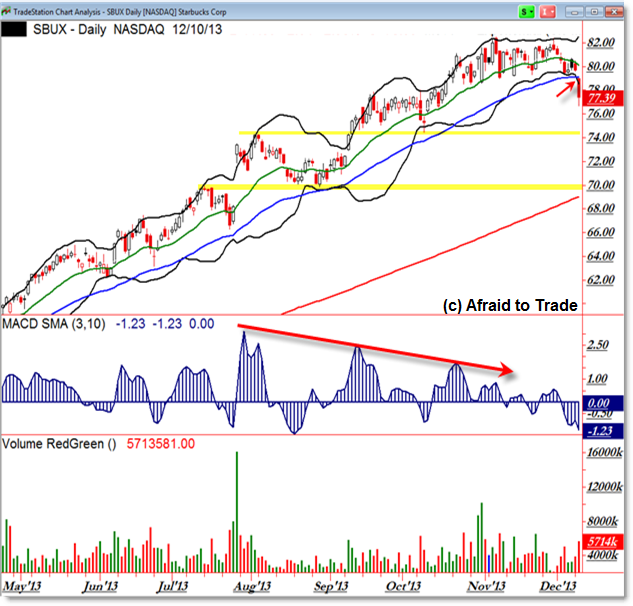
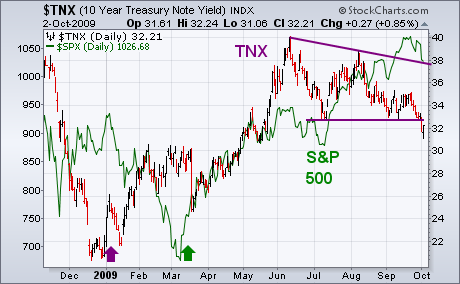
S&P The futures have reached and slightly exceeded the trendline that extends off of the May and July highs but the index is right at the trendline. The most striking observation at the current juncture is the non confirmation between the Nasdaq (e-mini future) and S&P (e-mini future). Such divergences have marked important turns since the 2009 low.
Prepared by Jamie Saettele, CMT
USDOLLAR (Ticker: USDOLLAR ): The triangle remains the favored view. As focused on recently Expect support from the triangle support line at about 9900. Todays low is 9905 (upside favored against 9856). Price pattern and the psychological environment (one and the same in my book) are ripe. The conditions that attend violent market turns have been met.
Prepared by Jamie Saettele, CMT
EURUSD has reversed from channel resistance and the 61.8% retracement of the decline from 13197 at 12978. I maintain that risk is lower as long as price is under 13080 (despite the record COT positioning ). Exceeding 13080 however would shift focus to 13200. 12835/80 is a support zone and 12940 is near term resistance (favor shorts into that level).
Prepared by Jamie Saettele, CMT
GBPUSD Favor shorts into 15500/30 with a stop above the early month high of 15670. From an Elliott perspective, the rally from the 1/13 low composes wave iv within an ending diagonal.

AUDUSD An AUDUSD top is either in place or will be with one more high (above 10450). Price pattern since Tuesday is a triangle and the implications are for a pop above 10450 before the reversal. Watch 10470-10500 for resistance. Yesterdays double inside day study may be of interest.
NZDUSD A picture perfect A-B-C advance may be complete in the NZDUSD. At minimum, price is at resistance and a dip is expected towards 7980. A drop below 7912 would confirm a reversal and shift focus towards 7770 and 7650. Having reached and held support, respect the potential for a new high (8105 would be resistance).
USDJPY Traded in a 60 pip range yesterday, which is actually more than 1.5 times its 20 day average range. Time will tell if todays move is the beginning of a sustainable move. For now, respect the range. The resistance zone is the current level (20 day average) to former support at 7760. Support is the series of lows since November near 7650.
USDCAD Traded just under its January low of 10075 yesterday and reached the -2 nd standard deviation band for the first time since the October low (10/27). Pattern at this point lacks clarity but an intraday key reversal yesterday (240 minute bar that ended at 13:00) warrants a cautious bullish bias as long as price is above 10050
USDCHF The USDCHF has broken the support line that extends off of the December and January lows and is approaching the January low of 9304. A drop under there would negate any constructive bias and shift focus to the 12/21 low at 9242 and the 11/30 low at 9065. 9380-9410 is now resistance.
— Written by Jamie Saettele, CMT, Senior Technical Strategist for DailyFX.com
To contact Jamie e-mail jsaettele@dailyfx.com. Follow me on Twitter @JamieSaettele
To be added to Jamies e-mail distribution list, send an e-mail with subject line Distribution List to jsaettele@dailyfx.com
DailyFX provides forex news and technical analysis on the trends that influence the global currency markets.
Learn forex trading with a free practice account and trading charts from FXCM.


