Short Term Trading With Bollinger Bands
Post on: 16 Март, 2015 No Comment

September 16, 2010 By Kenny
Today’s guest is Markus Heitkoetter, CEO of Rockwell Trading and author of “The Complete Guide to Day Trading. ” Today Markus is going to show you how to use one of our favorite indicators, Bollinger Bands, in short term trading. Be sure to comment with your thoughts on Bollinger bands and some techniques that you use in short term trading.
Bollinger Bands are a great indicator with many advantages, but unfortunately many traders don’t know how to use this amazing indicator. Before I show you how I use it, let’s quickly review what exactly Bollinger Bands are.
Bollinger Bands consist of three components:
- A simple moving average
- TWO standard deviations of this moving average (known as the Upper and Lower Bollinger Band).
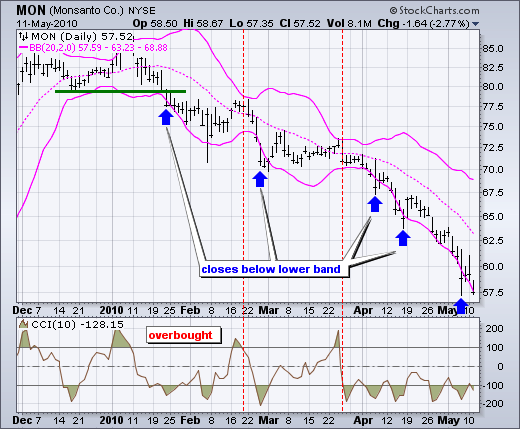
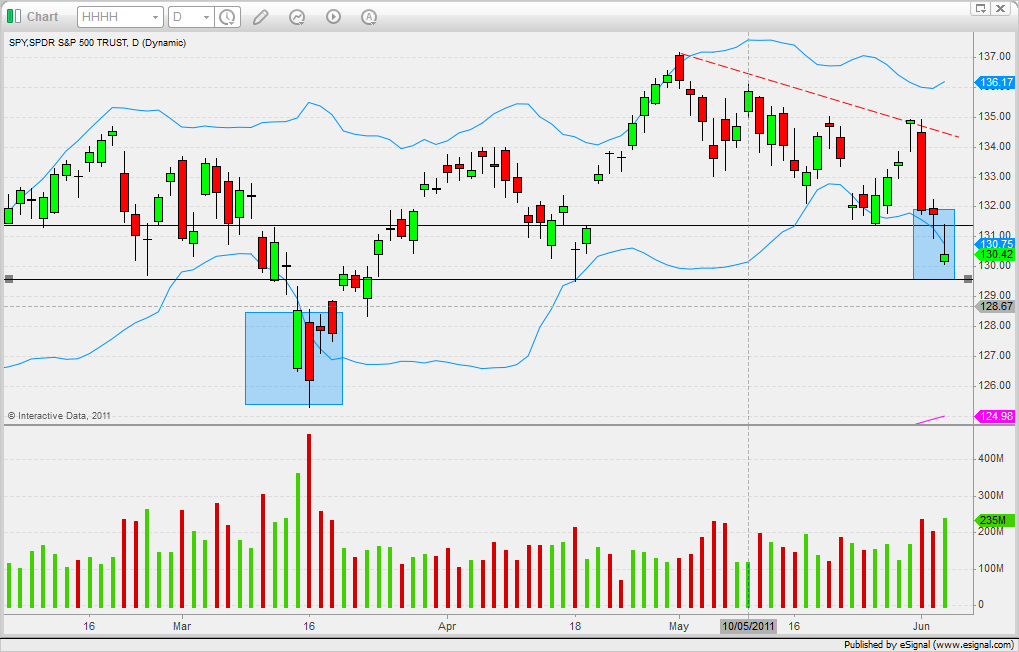
If you look at the following images you see the Moving Average displayed as a solid blue line and the Upper and Lower Bollinger Bands as dotted blue lines. (In MarketClub the lines are red.)
So what are the characteristics of Bollinger Bands?
Depending on the settings, Bollinger Bands usually contain 99% of the closing prices. And in sideways markets, prices tend to wander from the Upper Bollinger Band to the Lower Bollinger Band. With this being the case, many traders use Bollinger Bands to trade a simple trend fading strategy: They SELL when prices move outside the Upper Bollinger Band and BUY when prices move outside the Lower Bollinger Band. This actually works reasonably well in a sideways market, but in a trending market you get burned.
So how can you avoid getting burned? By understanding the direction of the market.
I use indicators to determine the direction of the market, and decide whether the market is trending or not. And Bollinger Bands are one of the three indicators that I use for this task.
For short term trading I prefer to use a moving average of 12 bars and a standard deviation of 2 for my settings. In many charting software packages the standard settings for the Bollinger Bands are 18-21 for the moving average and 2 for the standard deviation. These settings are great if you are trading on daily or weekly charts, but John Bollinger himself suggests that when DAY TRADING you should shorten the number of bars used for the moving average. John Bollinger suggests a setting of 9-12, and for me the best setting is 12.
With these settings you will find that in an uptrend, the Upper Bollinger Band points nicely up and prices are constantly touching the Upper Bollinger Band. The same is true for a downtrend: If a market is in a downtrend, you will see that the LOWER Bollinger Band is nicely pointing down and prices are touching the lower Bollinger Band.
How can you know when a trend is over and the markets are moving sideways again?

Well, the first warning sign that the trend might be over is when prices are moving away from the Bollinger Band. And you know that an uptrend is over, at least for now, when the Upper Bollinger Band flattens.
The same applies to downtrends: The first warning sign that a downtrend is over is when prices are moving away from the Lower Bollinger Band, so they are no longer touching the Lower Bollinger Band. And you know that the move is over when the Lower Bollinger Band flattens.
How can you use this information in your trading?
Well, if you use a trend-following strategy, you start looking for LONG entries as soon as you see the Upper Bollinger Band pointing nicely up with prices touching the Upper Bollinger Band. When you see that prices are no longer touching the Upper Bollinger Band, you move your stop to break-even and/or start scaling out of your position. And when the Upper Bollinger Band flattens, you exit your long position, since you know that the trend is over.
You see, when the market is moving sideways, you don’t make any money being in the market just hoping that the market will continue to trend. So exit the position before the market turns around, because you can always re-enter when you see that the market is trending again.
In fact, a strategy I call the Rockwell Simple Strategy actually relies on price tagging an Upper Bollinger Band as an entry signal: With this strategy I use MACD to confirm an uptrend, and I wait until the Upper Bollinger Band starts to point up. I then enter at the Upper Bollinger Band with a stop order, waiting for the market to come to me. I am then using a stop loss and a profit target based on the AVERAGE DAILY RANGE. This strategy is really beyond the scope of this article since we are focusing on Bollinger Bands, but this is exactly how I use Bollinger Bands to determine the direction of the market and decide on the trading strategy I will use.
So as long as the Upper Bollinger Band is nicely pointing up or down, I am looking for entries according to my trend-following strategies like the Simple Strategy. Once the Bollinger Bands flatten, I am looking for entries according to the sideways strategies I trade. You always want to trade a trend-following strategy in a trending market and a trend-fading strategy in a sideways market.
As you can see, Bollinger Bands offer tremendous help to determine the direction of the market and decide what trading strategy to use. Many traders learn how to use Bollinger Bands to fade the market, but they can be even more powerful when used to trade trends, and in determining the direction of the market.
Best,
Markus Heitkoetter
Markus is CEO of Rockwell Trading and author of the international bestseller “The Complete Guide to Day Trading”. For a limited time INO Blog Readers can download his book free here .


