Richer Rich and Poorer Poor
Post on: 16 Март, 2015 No Comment

Dollars to doughnuts.
A while back I wrote about how there was greater inequality in wealth than there was in income. Now a new report from the Pew Economic Mobility Project shows that across the income distribution, every income class is earning more than it used to, even if the raises are uneven. But when it comes to the wealth distribution, the rich are getting richer and the poor are getting poorer.
The report is based on data from the Panel Study of Income Dynamics, or P.S.I.D., a longitudinal data set that has followed families from 1968 to the present. First Pew looked at the earnings of todays adults compared to those of their parents generation, and found that the typical American in each income quintile earned more than his counterpart from a generation earlier.
Pew Economic Mobility Project Notes: Numbers are adjusted for family size. Each quintile contains 20 percent of the weighted sample. The dashed line represents the 95th percentile of the P.S.I.D. sample.
The median person in the panel today earns a family income of $51,177, whereas the comparable figure from a generation ago was $27,036 after adjusting for inflation. You can see similar bumps upward for the typical family in other quintiles, and that the very highest earners got the biggest raises.
The median family in the top quintile earned $49,075 a generation ago, and $111,115 today, an increase of 126 percent in inflation-adjusted terms. Thats a much bigger raise, no doubt, but at least every income strata saw its earnings rise.
The trend for the distribution of wealth looks somewhat different.
Pew Economic Mobility Project Notes: Wealth is adjusted for age and includes home equity. Each quintile contains 20 percent of the weighted sample. The dashed line represents the 95th percentile of the P.S.I.D. sample.
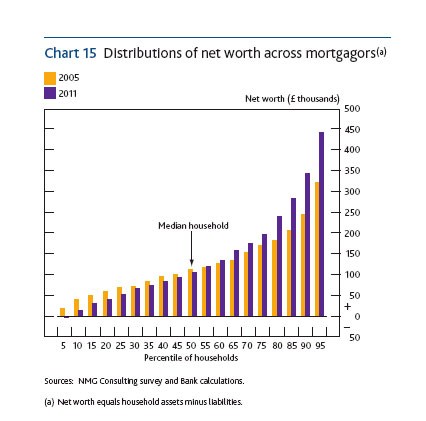
Unlike with income, there were not across-the-board gains for wealth. The median person in the poorest quintile has a family net worth that is 63 percent less than that of his counterpart a generation ago: $2,748, versus $7,439.
There were similar drops in wealth for the next two socioeconomic strata.
On the other hand, the top fourth and fifth quintiles by wealth have gotten richer.
The median family in the top socioeconomic class today (i.e. the family at the 90th percentile) is worth $629,853, compared to $495,510 in the last generation. Thats a 27 percent increase in the size of the median fortune in the top income stratum.

In other words, compared to the last generation, wealth has been become more concentrated in the hands (and bank accounts and houses) of the richest Americans. Exactly why is debatable. The global markets for labor and capital have changed, of course. And the lower tax rate on capital gains which disproportionately helps richer people, who have more capital to invest has helped the richest amass ever higher net worths.
In case youre interested, here are some more details on how these numbers were calculated, from the reports appendix:
The sample size for the analysis of wealth includes 2,277 children of the original PSID families who were between the ages of zero and 18 in 1968 and were tracked into adulthood.
Because wealth was first collected in 1984, parents’ wealth is measured in that year only. For the children, wealth is measured as the mean value taken in 2001, 2003, 2005, 2007, and 2009.
The limited availability of wealth data for parents produced differences in the mean ages for the parents and children. The average age of parents when wealth is measured was 55, and the average age of children was 46. To address the effects that an age gap in wealth measurement might have on intergenerational comparisons of wealth, age adjustments were performed on the data to make the parent and child generation wealth data more evenly matched
Note that most of data on wealth of the childrens generation are from before the housing bubble burst. If anything, then, these data may overstate the wealth of the childrens generation.


