Recovery Baltic Dry Index Says Hold On
Post on: 2 Июль, 2015 No Comment

Just as with the stock market, I’ve maintained that the advance seen since the early 2009 lows, in other asset classes, are also counter-trend moves. This view has not changed and based on my research I believe that once these counter-trend bounces have run their course, the longer-term secular bear will again reassert himself. In doing so, I look for all asset classes to decline in conjunction with the phase II decline of the ongoing secular bear market, which I believe is similar to the 1966 to 1974 secular bear market.
It is widely believed that the economy has bottomed and that the worst is behind us. It is also widely believed that the Fed has every thing under control and that “they” will not let bad things happen to us. Well, they were also in “control” in 2000 and I would hope that you all remember the nearly 40% decline into the 2002 low. They were also in “control” in 2007 as the 54% decline seen by the Industrials began and it was not until the market and the economy hit their natural cyclical bottoms that these declines were halted. Of course, once the lows were made the Fed was credited for having saved the world. Fact is, the Fed is not in control. Rather, they react to the natural cyclical forces of the market. In doing so, their reactions ultimately only serve to make matters worse. As an example, it should be obvious that the reactions surrounding the decline into the 2002 low and the efforts to stimulate the economy into 2007 created not only the housing crisis and the rising commodity prices that were seen into the 2008 top, but also the credit crisis and the collapse which all made the decline into 2009 worse than the initial problem they were trying to solve in the first place. People want to think that someone is in control and that “they” won’t let this or that happen. Fact is, “they” are not really in control and all “they” do is react and in doing so, again, “they” only serve to make matters worse and I believe that this time is no different. As the markets moved down into the 2009 lows the Fed pulled out all the stops and have literally thrown the kitchen sink at keeping things afloat. But, fact is, the markets moved into their natural cyclical lows in 2009 and once these counter-trend bounces have run their course, we should see that once again, all “they” have done is to make matters worse.
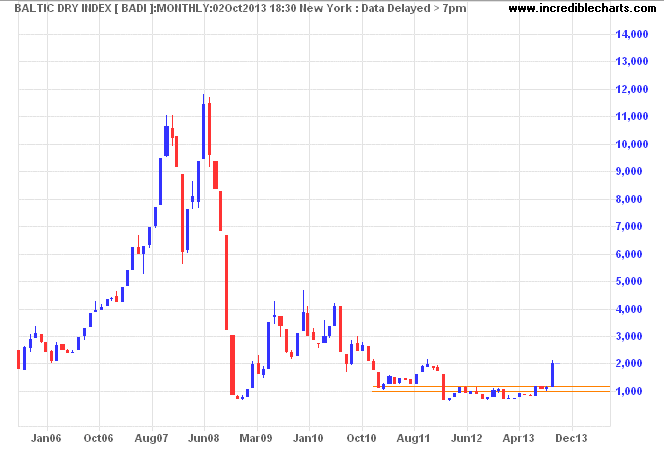
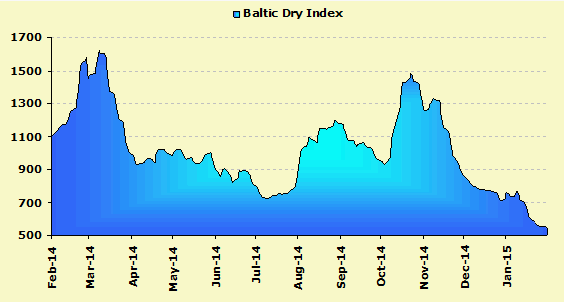
Now I want to take a look at the Baltic Dry Index, which does not lend itself to speculation or manipulation as do stocks or commodities. This chart can be found below. In this chart I show data going back to 1985. I have identified the longer-term cycle that has historically averaged some 3 years from low to low. For a year now, the indications have been that this cycle has already peaked. For those who are not familiar with this index, I have copied the following documentation from Wikinvest.com.
The Baltic Dry Index is a daily average of prices to ship raw materials. It represents the cost paid by an end customer to have a shipping company transport raw materials across seas on the Baltic Exchange. the global marketplace for brokering shipping contracts. The index is quoted every working day at 1300 London time. The Baltic Exchange is similar to the New York Merc in that it is a medium for buyers and sellers of contracts and forward agreements (futures) for delivery of dry bulk cargo. The Baltic is owned and operated by the member buyers and sellers. The exchange maintains prices on several routes for different cargoes and then publishes its own index, the BDI, as a summary of the entire dry bulk shipping market. This index can be used as an overall economic indicator as it shows where end prices are heading for items that use the raw materials that are shipped in dry bulk.

The BDI is one of the purest leading indicators of economic activity. It measures the demand to move raw materials and precursors to production, as well as the supply of ships available to move this cargo. Consumer spending and other economic indicators are backward looking, meaning they examine what has already occurred. The BDI offers a real time glimpse at global raw material and infrastructure demand. Unlike stock and commodities markets, the Baltic Dry Index is totally devoid of speculative players. The trading is limited only to the member companies, and the only relevant parties securing contracts are those who have actual cargo to move and those who have the ships to move it.
It is my belief that the weakness seen in the Baltic Dry Index is confirming my conclusions that the rallies out of the 2009 lows are likely counter-trend bear market affairs and not a result of strong fundamental growth nor of a sustained “recovery.” Through my research I have identified a very specific DNA Marker that has appeared at every single top in stock market history. I have also identified similar data for commodities and other indexes as well. Once the DNA Markers are in place, not only will the stock market be at great risk, but so will commodities and the economy as a whole. The key now will be the formation and confirmation of the DNA Markers to cap these rallies and this is all covered on an ongoing basis in the monthly research letters at Cycles New & Views . With this all said I want to warn you that just as the talking heads and politicians did not see or understand the setup that lead to the declines into the 2000 top lows or the 2007 top, they do not see nor do they understand the current environment and even if they did I can promise you that they would not tell you. For the record, I did have the advantage of my research and the DNA Markers to guide me during those periods. As a result, it did in fact allow me to identify not only the 2000 top in equities, months before it became obvious, but also the 2007 top in equities, the 2008 top in commodities and even the top in housing in 2005, all ahead of time. I sincerely hope that people are listening now. There is another downturn ahead of us.


