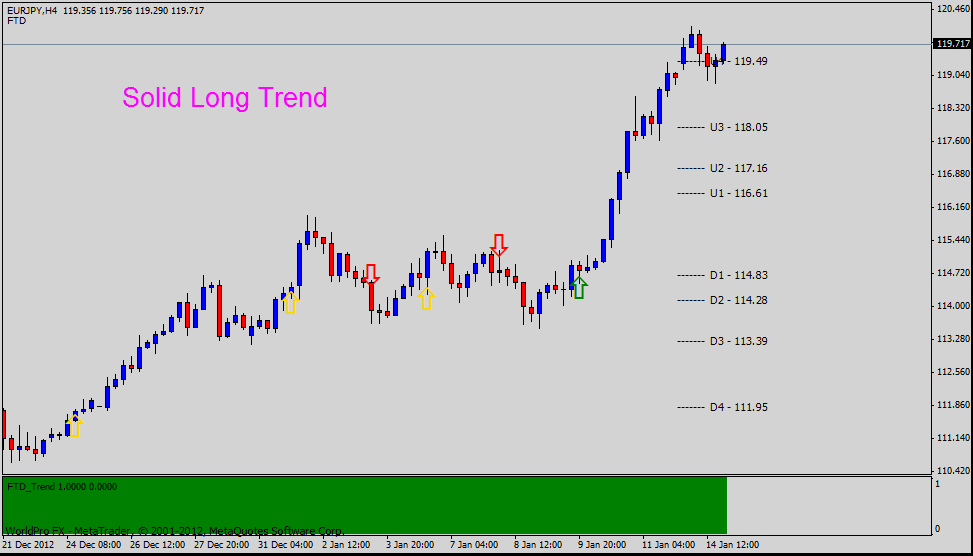
Pick your stocks or long term options using this method
Post on: 16 Март, 2015 No Comment

Hi friends
Trading profits don,t need a very complicated strategy. a simple thing a hint can break the market and bring you money.
here is something of that sort.
//note =this code is not mq4-this is ninja script
// AK Trend ID Version 1.00
// This indicator simply identifies if the market are
study(AK_TREND ID (M))
input1 = 3, input2 = 8.
fastmaa = ema(close,input1)
fastmab = ema(close,input2)
bspread = (fastmaa-fastmab)*1.001
adline = 0
m = bspread > 0. lime. red
plot (adline,color = white)
plot(bspread, color = m)
barcolor( bspread > 0. green :red)
=====================================
Somebody can code it easily into metatrader. it needs price on monthly chart,ema3 close,ema8 close, and in lower pane have PPO with ema3,ema8 and zero line.
concept as described by ak himself
Are we at the top yet. . Is it a good time to invest. . Should I buy or sell. These are the many questions I hear and get on the daily basis.
1000’s of investors do not know when to go in and out of the market. Most of them rely on the opinion of experts on television to make their investment decisions. Bad idea .

Taking a systematic approach when investing, could save you a lot of time and headache. If there was only a way to know when to get in and out of the market. hmmmm. The good news is that there many ways to do that. The bad news is. are you disciplined enough to follow it.
I coded the AK_TREND ID specifically to identified trends in the SPX or SPY only . How does it work. very simply. I simply plot the spread between the 3 month and 8 month moving average on the chart.
If the spread > 0 @ month end = BUY
if the spread < 0 @ month end = SELL
The AK TREND ID is a LAGGING Indicator. so it will not get you in at the very bottom or get you out at the very top. I did a backtest on the SPX from 1984 to 7/2/2014 (yesterday), The rule was to buy only when the AK TREND ID was green. let’s look at the result:
14 trades. 11 W 3 L. 78.75 % winning %
Biggest winner (%) = 108 %
Biggest loser (%) = -10.7 %
Average Return = 27 %
Total Return since 1984 = 351.3 %
You can see the result in detail here. hxxps://docs.google.com/spreadsheets/d/1-w9f8zlXunrV5dbTc5i3gJN-55vxPTySQv0ooCJCnu0/edit?usp=sharing


