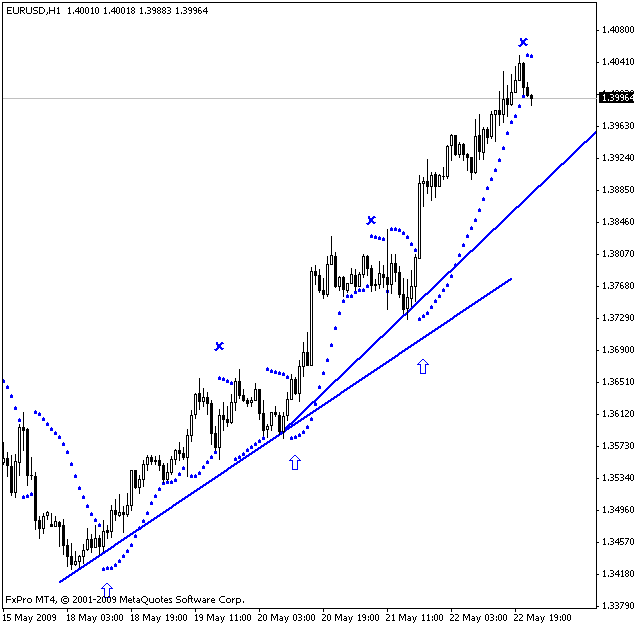
Parabolic SAR Indicator Trend Indicator
Post on: 16 Март, 2015 No Comment

Introduction:
Parabolic SAR is a trend indicator and generally used for short term to midterm trading strategies. This indicator was first described by Welles Wilder in his book “New Concepts in Technical trading Systems”. SAR has the quality to trail the price for a specific period of time. Most of the indicators for short term trading is quite complex to interpret and use. SAR is popular for its simplicity as a short term trading indicator.
Parabolic SAR can measure short term trend direction and price momentum. This indicator also known as “Stop and Reversal System”.
Interpretation:
Parabolic SAR is very helpful to determine short term and midterm trend. Parabolic SAR appears as small dots above and below the candlesticks. If the SAR dot is below the candlestick then the trend is considered as an uptrend. Inversely, if SAR dot is above the candlestick then the trend is considered as a downtrend.
Trend reversal occurs as SAR dots moves below and above the candlesticks. A buy signal generates as SAR dot moves below the candlestick from above and a sell signal generates as SAR dot moves above the candlestick from below. Here is an example chart given below.
4 hour chart of EUR/USD is showing uptrend and downtrend according to parabolic SAR indicator.
However, many traders decide to wait for confirmation after getting a buy or sell signal. These traders tend to take buy and sell decisions after getting three consecutive dots during trend reversals. For example, three dots below the candlestick is a buy signal and three dots above is a sell signal.
This method allows a trader to take more confirmed entries, but traders might have to enter after significant price gap. More confirmed entries can save traders from getting lots of false signals. Here is an example chart given below.
4 hour chart of EUR/USD is showing buy and sell signals with more confirmation. 1…2…3 dots below has taken as a buy signal or entry signal for long position and 1…2…3 dots above has taken as a sell signal. A dot in the reverse direction after taking an entry signal should be considered as an exit signal. As the exit signals of parabolic SAR are dynamic, traders do not need to use other stop loss or exit strategy. Parabolic SAR exit signals can define both exit and stop loss signals.
Summary:
Parabolic SAR basically used for deciding entry and exit signals based on short to midterm price change. Parabolic SAR is not so useful to determine long term trends without changing its parameters. Thus, other long term trend indicators should be used with this indicator as a combination.


