Moving Averages in Technical Analysis and Commodity Trading
Post on: 15 Август, 2015 No Comment

Moving averages are one of the most popular technical studies used in commodity and stock trading. The most commonly used technique of moving averages is for purposes of determining the trend of the market as well as finding support and resistance levels.
The calculation of a moving average is actually very simple. All you have to do is find the number of periods you want to measure and add the closing prices of all those periods. Once you have the sum of all the numbers, divide by the number of periods.
There are many variations of the moving average, where calculations are performed differently to achieve different result. The most popular form of moving average, which I happen to use, is the exponential moving average. I like the exponential moving average because it puts a higher weighting on the most recent prices. Therefore, it tends to adjust more accurately to prices than other moving averages and many professional traders prefer the exponential moving average.
Don’t worry about the actual calculations of moving averages. Just about every website with commodity charts will have a function to add several types of moving averages to the charts. You can also adjust the number of periods in the moving average. The good thing about moving averages is they apply to 5 minutes charts just as easily as weekly charts and the trading techniques work just the same across all time periods.
The most common timeframes for moving averages are the 20, 50, 100 and the 200 period moving averages. These settings are commonly used for determining the trend of the market and traders will typically only trade in the direction of the trend. There are many ways to utilize moving averages in your trading, but I’ll explain how I use moving averages in my trading.
Most people trade off the daily charts, but there are day traders who use shorter timeframes. The 5-minute chart is probably the most common timeframe for those who day trade futures. However, for explanation purposes I will use the daily charts. In this case, a 20-day moving average would refer to the weighted average of the closing prices of the last 20 days.

The first thing I do is look for a market that has been trading above or below a 20 day moving average for at least two weeks and it is exhibiting characteristics of a trending market. Once these two requirements have been satisfied, I will look to enter the market on a pullback to the moving average. Basically, this is a disciplined way of buying pullbacks in a trending market.
A more conservative way to trade this technique is to wait for a touch of the moving average and then you enter if the market takes out the high of that day for uptrending markets or the low of that day for downtrending markets. Sometimes the market will cross through the moving average or the trend will reverse, so this could save you from a losing trade. In the long run, this is probably the better way to trade this technique.
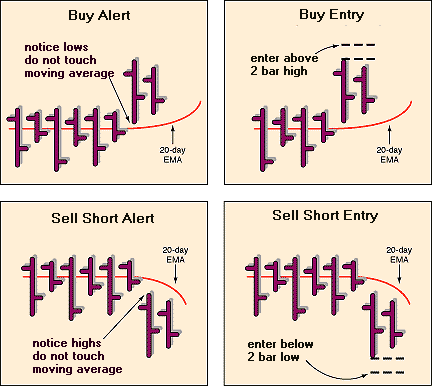
If you find a strong trending market and it breaks through the 20 day moving average on a pullback, you might have found an even better trade. Al Brooks outlines this technique well in Reading Price Charts Bar By Bar . Essentially you want to see the daily range of a price bar completely on the opposite side of the moving average. This is called a moving average gap. Once you spot it, you can enter on the first bar that moves above the high of the gap bar for uptrending market and below for downtrends.
There are other techniques for moving averages such as moving average envelopes and moving average crossovers that all have their own merits. The key is to stick with a technique that works for you and stay disciplined while trading. Constantly jumping from one technique to another is a recipe for disaster.


