Measuring Implied and Historical Volatility
Post on: 18 Июль, 2015 No Comment

Volatility is a term used to describe movements of securities within the capital markets. Volatility is referred to past price action as well as potential future price movements which is reflected by market participants and referred to as implied volatility.
Implied volatility fluctuates with market sentiment as is altered by external impetuous, such as monetary policy, economic data, and earnings announcements, as well as by, changes in sentiment generated by investor fear and greed.
Implied volatility is an input that is used to create the value of an option given that the price of an option is predicated on the chance that a security will be above or below a specific strike price on or before a certain date. To calculate that probability, an analyst needs to use an estimate of how much the security is likely to move over the course of a year. This gauge is implied volatility which his generally quoted in percentage terms.
During the past decade, the explosion in exchange traded fund (ETF) investment products, has lead to the creation of implied volatility products. Implied volatility ETFs generally track a specific volatility indices.
Historical Volatility
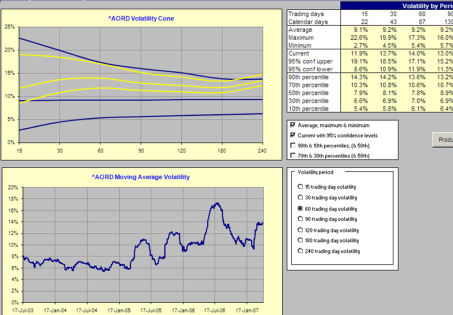
Volatility that is viewed in the rear view mirror is referred to a historical volatility. Past price action is used for a number of specific risk calculations, which include value at risk (VAR) which examines the loss associated with a specific volatility (usually 2-standard deviations). By looking at the historical volatility of assets within a portfolio, an analyst can calculate the value at risk of the portfolio. The volatility of multiple assets along with the correlation of the assets can assist in determining the worse case outcome for the portfolio.
Historical volatility is a measure of the daily (or weekly, monthly etc) standard deviations which are used to create an annualized move of a security on a percent basis. Historical volatility is a relevant within the financial community as it is one of the key components for determining risk calculations and can also be used in valuing options.
Historical volatility is formulated by comparing the standard deviation the returns of a financial instrument and multiplying that number by the square root of time. This formula will create a decimal which can be reflected as a percent, which describes a move over an annualized basis.
Implied Volatility
Implied volatility is the markets estimate of the future movement of a security in percent format. Implied volatility is traded actively in the form of option structures, such as calls, puts, straddles or strangle, or in the form of ETFs which focus on specific volatility indexes. It is a market-based measurement and therefore it fluctuates with market sentiment.
The most widely known and traded benchmark for volatility is the VIX volatility index, created by the Chicago Board of Options . The VIX measures the implied volatility of the S&P 500 index by tracking the strike prices of at the money S&P 500 options. On the Chicago Board of Options, the VIX trades as a future contract as well as an option on a futures contract. This VIX is also traded in the form of an exchange traded fund and exchange traded notes.

Implied volatility is a key input into options pricing models. As implied volatility increases, with all other inputs remaining the same, the price of an option increases in value. As implied volatility declines, with all other inputs remaining the same, the price of an option declines in value. Implied volatility also reflects the supply and demand of an option, and trades like a security reflecting market participant’s sentiment.
Monitoring Volatility
Investors need to monitor volatility to understand sentiment within the financial markets. When the markets are volatile, investors should understand how that could affect their portfolio or new transactions. Volatility generally measures both fear and greed within the financial markets.
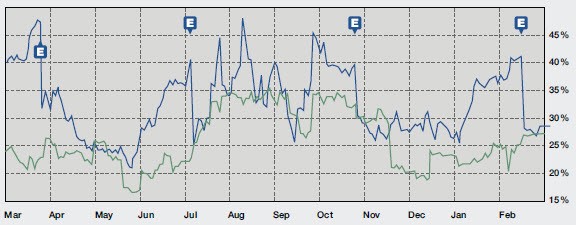
Implied volatility and historical volatility can fluctuate above and below each other. Generally, implied volatility is higher than historical volatility which is why the majority of long options trades expire worthless.
Historical volatility and implied volatility are too similar components that are used to trade the financial markets. While historical volatility is used mainly to gauge the risks associated with a portfolio, implied volatilities are considered market inputs which alter the values of options on financial instruments.
One way to chart historical implied volatility is through indices such as the VIX volatility index or to purchase a software package that chart historical implied volatility. The VIX volatility index is a product created by the Chicago Board of Options Exchange which follows the implied volatility of the “at the money” puts and calls of the S&P 500 index. There are many other index specific volatility gauges which are calculated in a way that is similar to the VIX.


