MACD Learn to Trade the MACD Indicator Part 2
Post on: 24 Июль, 2015 No Comment

MACD: Learn to Trade the MACD Indicator, Part 2
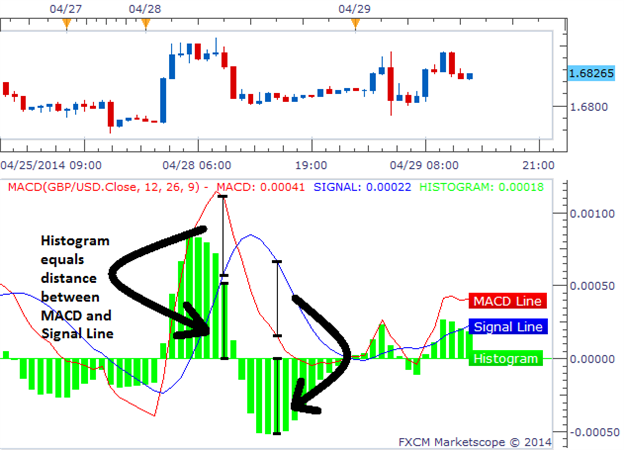
In our last lesson we looked at the different components that make up the MACD indicator. In todays lesson we are going to look at how traders use the MACD to identify whether or not a market is trending, how strong that trend is, and where good potential entry and exit points are.
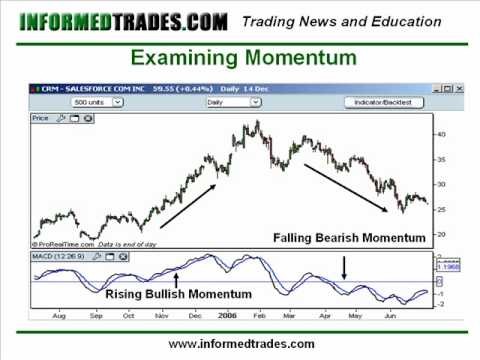
As we learned in our last lesson the MACD indicator is used to identify trends in the market and the momentum of those trends. Because of this the MACD is an indicator that traders will look to trade when the market is trending and avoid when the market is range bound.
In addition to being able to tell if the stock, futures contract, or currency you are analyzing is trending or not from simply looking at its price action on the chart, you can also use the MACD indicator. Very simply if the MACD line is at or close to the zero line, this indicates that the financial instrument you are analyzing is not exhibiting strong trending characteristics, and thus should not be traded using the MACD.
Example of Identifying Trending and Non Trending Markets with MACD
Once it is determined that the financial instrument you are analyzing is exhibiting trending characteristics, there are three ways that you can trade the MACD.
1. Positive and Negative Divergence
2. The MACD/Signal Line Crossover
3. The zero line crossover
Trading the MACD Divergence:
Divergence occurs when the direction of the MACD is not moving in the same direction of the financial instrument you are analyzing. This can be seen as an indication that the upward or downward momentum in the market is failing. Traders will thus look to trade the reversal of the trend and consider this signal particularly strong when the market is making a new high or low and the MACD is not.
Example of MACD Negative Divergence
Trading the MACD Crossover

This is the simplest way to trade the MACD as it involves simply watching the MACD line and going long when the MACD line crosses above the signal line and going short when the MACD line crosses below the signal line. As this strategy generates the most signals, it also generates the most false signals, and the potential to get into a bad trade using just this method is high. For this reason traders will confirm the signals with other methods such as the chart patterns we have learned so far, volume etc.
Example of Using the MACD Crossover as Buy and Sell Signals
The MACD Zero Line Crossover:
The MACD zero line cross over occurs when the MACD crosses above or below the line plotted at point zero on the indicator. When this occurs it is an indication that market momentum has reversed direction. The strength of the move that can be expected as a result of this depends on what has been happening in the market, and what has been happening with the indicator. If the market and the MACD are both coming off of recent new highs then this could be considered a strong signal. If the market is simply trading in a weak trend or range and the MACD has simply crossed from just above to just below the zero line, then this would be considered a weak signal.
Example of a Bullish and Bearish Zero Line MACD Cross:
As with all of the indicators that we are learning about in this series it is normally better to trade the MACD along with other confirming signals such some of the things we have learned so far like trend lines, chart patterns, and breaks of significant support resistance levels.


