MACD Indicator and Stochastics
Post on: 24 Июль, 2015 No Comment

Moving Average Convergence Divergence Indicator and Stochastics
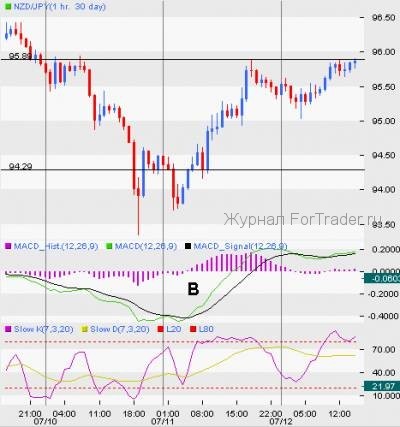
I always like to start off with the monthly charts. Even though I’m going to be doing most of my trading in the futures market, for the stock indexes I will look at the cash index for monthly charts. This is because there is much more history here to view, as the cash index has been around a lot longer than the stock index futures contracts. The first thing I look at is the Stochastics and MACD indicator (Moving Average Convergence Divergence) readings. The MACD indicator represents pressures on the market. Is the pressure more to the upside (buying pressure) or downside (selling pressure)? In general, I want to establish positions that are on the same side as the current dominant pressures in the market I am trading. My rule of thumb for this is as follows:
The Stochastics is the heads up, and the MACD indicator is the confirmation.
This brings me to why I place little value on whether a Stochastic is overbought or oversold. According to the Stochastics the S&P was overbought starting in the middle of 1995, and it stayed overbought until the middle of 1998—three long years. During that time this overbought market rallied over 100%. To me, an overbought Stochastic is actually a bullish sign—if the MACD indicator is also in a buy. This brings me to my next guideline:

MACD indicator (Moving Average Convergence Divergence) crossovers.
At point #1 the monthly MACD indicator crossed over into a sell signal in May, 2000, about 2 months after the Stochastics crossed into a sell. Once this happened, the path of least resistance on the monthly S&P chart officially switched from higher to lower. This means that, for longer term swing and position trades, I would start spending more time focusing on short setups, and generally ignore long setups. I would do this until the monthly MACD indicator went back into a crossover buy, and that happened at point #2, nearly 3 years later. Once this occurred, I started focusing more on long swing trading setups and generally ignoring most short trading setups. Remember, I’m talking about swing and position trades here, not day trades.
The snapshot of this chart was taken on April 5, 2005. At point #3, I can see that the Stochastics is trying to rollover into a sell. What does this mean to me? It means that, potentially, the MACD indicator could roll over into a sell. However, at point #4 we can see that the MACD is still in a buy. For me, this means that, for longer term swing and position plays, I will still continue to focus on the long side until the monthly MACD indicator rolls over into a sell.


