MACD Indicator
Post on: 16 Март, 2015 No Comment

Introduction
Many stock trading strategies are built around trading with the trends. The challenge is knowing when to get into the trade and when to anticipate a reversal of the trend. This article is about the MACD technical indicator. Learn the basics and gain insight into how MACD can help in determining when a trend reversal is pending. MACD is short for Moving Average Convergence Divergence. Many traders are familiar with the term MACD but don’t fully understand how to use it, until now. The MACD indicator is a standard offering with most all trading platforms.
MACD on the Stock Chart
To understand MACD, it will be helpful for you to open a stock chart. Add the MACD indicator to it. On the chart it will look something like this.
Notice that the above chart is for Apple. It consists of three sections. The top section is the price chart. The middle section is the MACD graph and the bottom section is the MACD Histogram.
The MACD settings are commonly used. They are:
- FAST exponential moving average — 12
- SLOW exponential moving average — 26
- Simple moving average SIGNAL LINE — 9
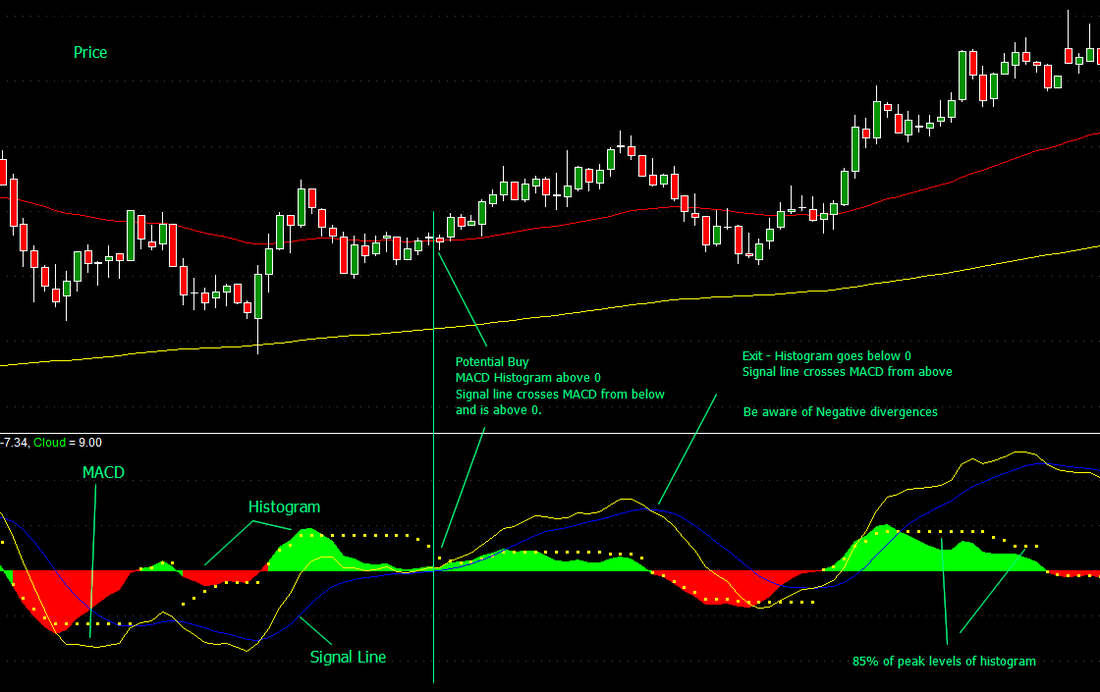
The middle section has two lines. The violet colored line is a plot of MACD which is the mathematical difference between the Fast exponential moving average and the Slow exponential moving average. The yellow line is a plot of the Signal Line which is a simple moving average.
The bottom section is a histogram that plots the mathematical difference between the MACD line and the Signal Line. The green bars represent a measure of the degree to which the MACD line is greater than the Signal Line. The red bars represent a measure of the degree to which the Signal Line is greater than the MACD line. You’ll notice that the histogram is at 0 when the MACD line and Signal Line are equal.
Simple Explanation of MACD

Much of the above explanation may be a bit complex and difficult to comprehend. The important point to keep in mind is the following:
- When the histogram bars are green and increasing in length, the price action for the stock price is increasing in momentum.
- When these green bars are decreasing in length, the price action for the stock price is decreasing in momentum.
- When the histogram bars are red and increasing in length, the price action for the stock price is decreasing in momentum.
- When these red bars are decreasing in length, the price action is beginning to see some positive momentum.
Divergence
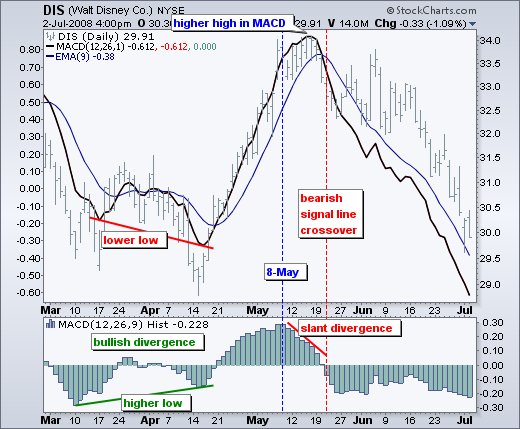
More experienced traders often use MACD to identify the potential end of a trend. To understand that we need to cover the subject of Divergence. To understand divergence, it may be easiest if we look at the following chart.
Notice the white line at the top of the price chart. Normally for an upward trend we will draw the trend line below the candlesticks. In this case I chose to draw it at the top. Notice how the while line is moving upward indicative of the price moving upward. Notice the white line at the top of the MACD chart in the middle section. That white line is moving down. Also notice the white line connecting the peaks of the green bars in the MACD Histogram in the bottom section is also moving down. If the upward trend was likely to continue, we expect these two white lines to be moving upward as well. In this case the while lines in the middle section and lower section of the above chart are moving down. This is an example of Divergence. Price action is moving up. MACD is moving down. The Divergence is indicating that the momentum of the upward movement is failing and could result in a downward movement of the stock price.
The chart below is the same Apple stock and we see that the price did in fact move downward (see circle) after the Divergence appeared. The momentum of the upward price movement did indeed fail. Traders that saw the Divergence before the price action moved down could anticipate the price action and profit from it.
Keep in mind that the Divergence condition does not always pan out to be true. It is likely to fail one-fourth of the time. Nevertheless, it is a popular and quite effective indicator of a coming change in the direction of an existing trend.
The MACD is a very popular technical indicator. Once you understand what it means, it can be very helpful in determining stock trading buy conditions and sell conditions, With an understanding of Divergence, the Trader can:
- Choose not to make a trade they were about to make
- Exit a trade early
- Prepare for a trend reversal


