Let s Learn TA RSI is not an Overbought Oversold Indicator
Post on: 17 Июнь, 2015 No Comment

The Relative Strength is not an Overbought/Oversold Indicator
Cho Sing Kum
30 th Dec 2002
For many people the very reason they learn Technical Analysis is the blind obsession of only wanting to know when to buy buy buy and when to sell sell sell. Nothing else is important to them. This group of people, they will fail repeatedly. For with this blindness, this ignorance, they will never be bothered to understand the mathematics, what they measure, how they behave, basically the original intention and interpretation of the indicators.
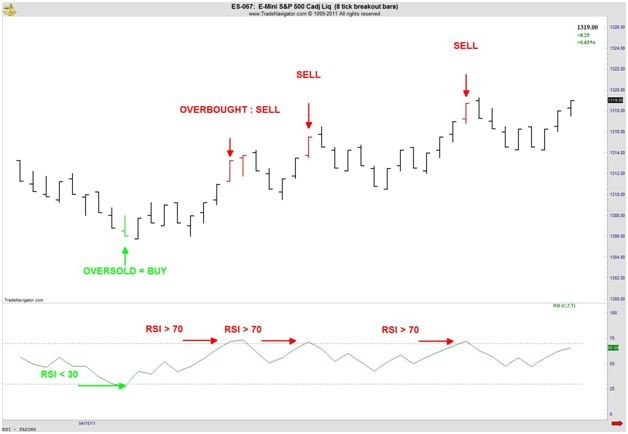
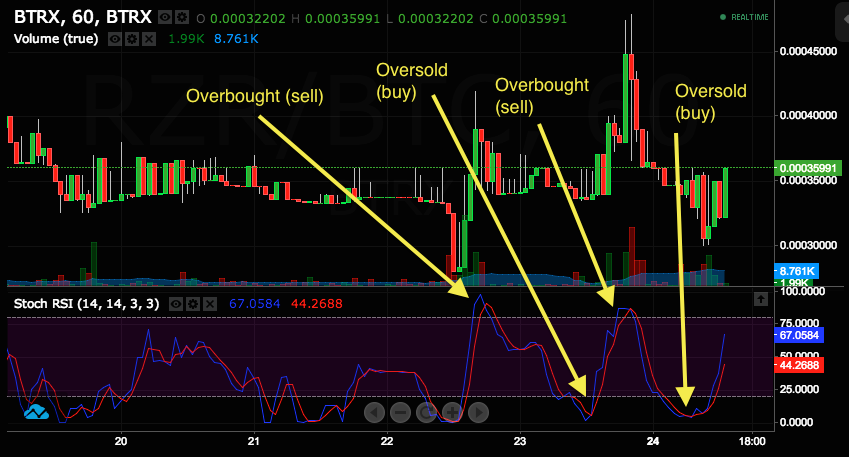
The Relative Strength Index is never an overbought/oversold indicator. If you did not learn Relative Strength Index from the original text, then it is very likely that you have been taught the wrong thing right from the beginning — that RSI is an overbought/oversold indicator. I want to tell you straight away that this is wrong.
The problem with the human mind is that the first time we hear about something, the first time we read about something, to our mind this is the truth about that something. Any subsequent thing they hear or read about it we would discard them as false. This is a mental problem. You may disagree but to me anything that has the source of the problem traced to the mind, to me this is a mental problem.
I quote from the second last paragraph of Section VI of the book New Concepts in Technical Trading Systems by J. Willes Wilder Jr. The words in bold are the way they were printed in the book. Do note the three words very carefully.
(5) Divergence: Although divergence does not occur at every turning point, it does occur at most significant turning points. When divergence begins to show up after a good directional move, this is a very strong indication that a turning point is near. Divergence is the single most indicative characteristic of the Relative Strength Index. Note that the top made on November 9 [1977 of the Jun78 Silver futures contract] was indicated by an RSI value above 70 and divergence. It was confirmed by the failure swing, breaking out of the pennant formation and breaking the support line.
What is failure swing? I quote from Wilder’s book again. The scan images of the actual illustrations from the book are below. They are Fig 6.3 and Fig 6.4 as in the book.
“(3) Failure Swings: Failure swings above 70 or below 30 are very strong indications of a market reversal. (See Fig. 6.3 and Fig. 6.4)”
If you are interested to learn the real thing or if you are interested to unlearn what you have learned wrongly then keep in mind what is meant by indicated and what is meant by confirmed. No where in the chapter on RSI, Section VI, did Wilder ever write that the RSI is an overbought/oversold indicator. Nowhere in his book did he write that RSI below 30 is oversold (therefore buy) and RSI above 70 is overbought (therefore sell). Nowhere is this ever mentioned in his book.
Learning the wrong thing from the wrong teacher is a universal problem. It also happens in religion. That is why in Buddhism there is a teaching that even if it takes twelve years, you still have to qualify your potential guru before you take him as your guru. Because even in religion, you too can learn from the wrong teachers, the fake ones. The present situation we have with extremist Muslim terrorism is an example.
Let me show you the chart of the US dollar against the Swiss Franc together with the 14-day RSI. The price bars were painted magenta for the days the RSI was below 30. Notice in late April the RSI went below 30. Wrong teachings would have told you that the US dollar was oversold, downside is limited, buy. There was an indication but there was no confirmation.
There was another indication in Jun and this was followed by a confirmation the following month (although the second low, the divergence, was preferred to be above 30). The US dollar went sideway after that.
There was another indication in Nov, last month, but there was no confirmation.

Can you see how dangerous this type of wrong teaching is? You could end up killing people who do not have the same religious belief as you and justify this by saying it is God’s teaching!
Right now, the RSI is once again below 30. This is an indication. So how now? Do we go screaming Oversold! Oversold! Buy! Buy! Buy! Well, for this to be confirmed, we need to see a divergence that is confirmed by a failure swing. Isn’t this correct? Which means the least we can expect is a correction rally in the US dollar, which we do not know whether this will happen and if so when this will happen, and then followed by another decline in the US dollar to a lower low. This price action to be accompanied by a RSI divergence and a failure swing.
Now only when you understand the mathematics that go into the calculation of the RSI and why is it calculated this way that you will understand why we have to wait wait wait. I hope you will agree that to buy US dollar in end-April is a stupid thing.
So you see, Technical Analysis is not about buy buy buy and sell sell sell. It is about understanding with intelligence. Which means you must not be mad to be able to do this.
At the end of my talk on RSI for Technical Analysts Society of Singapore three weeks ago, someone came up to me and said he noticed that after RSI went above 70 or below 30, it took some time before price reached a top or bottom. He said he did not understand it previously but now he did. As I watched him walked away, I noticed that sign of happiness on his face. It was those same ones I had whenever I realized where I had gone wrong and, which without fail, led me onto many journeys of discovery.
What then is the RSI? Wilders started the chapter on RSI explaining about momentum. He, the inventor of the RSI, is right. RSI is a momentum oscillator. Perhaps I should write a follow-up article, Relative Strength Index is a Momentum Oscillator .
It is alright with me if you deduce from here that all those who insist that the RSI is an overbought/oversold indicator and continue to teach it as such and get people to use it this way that I call them mad.
Important: These charts and commentaries are provided as an education on how technical analysis can be used. Technical Analysis & Research is not an Investment Advisor and we do not claim to be one. These charts and commentaries are not to be construed as investment advice or any other investment service other than the originally intended purpose as stated here.


