Journal of Asset Management On the riskreturn profile of leveraged and inverse ETFs
Post on: 29 Май, 2015 No Comment

Journal of Asset Management (2010) 11, 219–228. doi:10.1057/jam.2010.16
On the risk-return profile of leveraged and inverse ETFs
Guido Giese 1
Correspondence: Guido Giese, Research & Development, STOXX Ltd. Selnaustrasse 30, Zürich CH-8021, Switzerland. E-mail: guido.giese@stoxx.com
1 is Director of Research & Development at STOXX Ltd. in Zurich where he is responsible for applied research in the area of asset management and financial products and for the development of new asset management strategies. Before joining STOXX in 2008, he held managerial positions in various Swiss asset managers and international investment banks in the area of trading and financial products. Giese holds a PhD in Applied Mathematics from ETH Zurich, an MSc in Physics from the University of Heidelberg and an MSc in Economics from the University of Heidelberg.
Received 16 March 2010; Revised 16 March 2010.
INTRODUCTION
Leveraged investment products have become a widely used asset class in both the derivative market and the exchange-traded fund (ETF) market (cf EDHEC, 2009 ). With the recent financial turmoil, ETFs have become increasingly popular in comparison with derivative structured products, in particular long and short leveraged ETFs, which offer a different type of leverage strategy compared with certificates. In simple words, leveraged certificates such as mini-futures typically offer a leverage effect in the form of a constant Delta with respect to the underlying and consequently a time-varying leverage factor when the price of the underlying changes. In contrast to certificates, leveraged funds follow a dynamic leverage trading strategy to achieve a constant leverage factor, but a time-varying Delta exposure with respect to the underlying by a daily rebalancing of the investment portfolio.
At issuance, both strategies have in common that a certain leverage L is achieved by borrowing (L − 1) times the investment amount to be able to invest L times the investment amount into the underlying asset, and hence both strategies incur refinancing costs. However, while the replicating investment portfolio of a leveraged certificate is essentially constant in time (refinancing costs are continuously accrued and reflected in the portfolio value), leveraged ETFs are rebalanced every day to ensure a constant leverage L of the fund, that is, the ratio between the investment amount in the underlying and the size of the refinancing loan is kept at a level of L / L − 1 on a daily basis. The difference between the two strategies is summarized in Table 1 .
Leveraged funds and short funds are typically issued in the form of an index fund tracking a leveraged equity index, which exist for all major blue-chip equity indices (for example, leveraged versions of the CAC40, DAX, DowJones, EuroSTOXX 50, S&P500 and so on) and for many sector specific indices (pharmaceuticals, oil and gas and so on). On the long side, by far the most popular strategy is a leverage of two, but most index providers have also issued leverage three or even leverage four versions, at least on their respective blue-chip indices. On the short side, the single short (that is, leverage one) strategy is by far the most commonly used, but most index providers have added double short indices that use a leverage of two.
The advantage of the dynamic leveraged index fund strategy is the fact that in falling markets the Delta exposure is automatically reduced and hence the product value always stays positive, whereas the value of a certificate can reach zero and the certificate ceases to exist. Analogously, in bullish markets the leveraged fund gears up the portfolio on a daily basis, and hence profits more from the rising underlying price than the certificate. On the other hand, the rebalancing of the portfolio of a leveraged fund creates an adverse influence of volatility on the performance, as the example in Table 2 illustrates.
In the example in Table 2. the volatile behavior of the underlying has not changed the value of the underlying, but incurred a loss on the dynamic leveraged strategy, which is proportional to the variance of the underlying, as we will see.
A similar statement holds for short strategies, as we indicate in Table 3. comparing a short certificate to a short fund over 3 consecutive trading days.
Table 3 — Example of an underlying asset S and a short certificate and a short fund (both with leverage one) thereon.
Consequently, while the long-run performance of the leveraged certificate is L times the underlying performance less refinancing costs, the performance of the leveraged ETFs is more complex and depends on three parameters:
- The growth rate μ of the underlying – the higher the more attractive leverage becomes.
- The refinancing rate r – the higher the less attractive leverage is.
- The volatility σ of the underlying – the higher the less attractive leverage becomes.
Points 1 and 2 are also determinants of the performance of a leveraged certificate. However, point 3 is specific for leveraged funds and is due to the daily rebalancing of the portfolio.
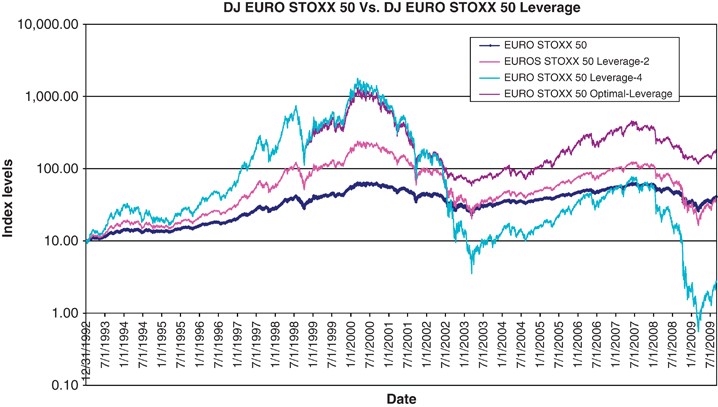
Although leveraged and inverse ETFs have become standard products in the financial industry, recent studies (cf Cheng and Madhavan, 2009 ; Despande et al. 2009 ; Lu et al. 2009 ) have pointed out that the performance characteristics of these strategies are fairly complex. In particular, the long-term performance of these funds is path-dependent with respect to the underlying, and is strongly influenced by the volatility of the underlying. Consequently, the long-term performance is not simply L times the performance of the underlying asset, but can be substantially higher or lower, depending on the behavior of the underlying. As a consequence, the authors point out that these products are often misunderstood by market participants, in particular regarding the degree of market risk implied by these strategies.
The purpose of this article is to develop a very general model for the long-term performance of a dynamic leveraged and inverse fund strategy, and to analyze its risk-return profile in detail in order to provide a detailed insight for investors into the behavior of these financial products.
MODEL DESCRIPTION FOR LONG LEVERAGE
We assume an underlying equity index S of the leveraged fund that follows a stochastic process, that is, with the growth rate u and volatility σ we have

where W t denotes a standard Wiener process. Consequently,
As funds typically track the total return versions of equity indices where dividends are assumingly reinvested, we can neglect the role of dividends and assume S to be the total return version of an equity index.
The process for a leveraged fund F on the underlying asset S with leverage factor L reads (cf NYSE Euronext, 2008a ; STOXX, 2010 )
In practice, the term dF refers to the daily change of the fund’s value, where the fund manager borrows (L − 1) times the value of the fund, incurring refinancing costs at the rate r. to invest L times the net asset value of the fund into the underlying S. Owing to daily rebalancing, the leverage is kept constant at the level L .
At first glance, one could assume that process (3) results in a fund value that is the L th power of the underlying value (2) less financing costs, that is, one can make the following ansatz for the fund value:
However, applying Ito’s lemma (cf Baxter and Rennie, 1996 ), we observe that the differential equation for (4) reads:
which does not coincide with the investment strategy (3). Comparing equations (3) and (5). we conclude that the actual value of the leveraged fund F includes an additional term representing the aforementioned volatility-related performance impact; and hence, instead of equation (4). the value of the fund reads:
In fact, applying Ito’s lemma to (6) reproduces the investment strategy (3). The resulting expected fund value reads:
The performance of the leveraged fund, according to equation (6), coincides with the findings of Cheng and Madhavan (2009). Despande et al (2009) and Lu et al (2009). except that we have added the role of refinancing costs into the strategy in form of the refinancing rate r .
Further, we derive the cumulative probability distribution of a percentage profit or loss x.
With the cumulative standard normal distribution Φ (·) and the observable growth rate of the underlying asset


