Investing for beginners Bollinger Band Indicator
Post on: 16 Март, 2015 No Comment

Bollinger Bands
Developed by John Bollinger, Bollinger Bands are volatility bands placed above and below a moving average. The bands automatically widen when volatility increases and narrow when volatility decreases.
Bollinger Bands arose from the need for adaptive trading bands and the observation that volatility was dynamic, not static.
Bollinger Bands consist of a set of three curves drawn in relation to the security’s price. The middle band is typically a moving average that measures the intermediate-term trend and serves as the basis for calculation of the upper band and lower band.
The interval between the upper and lower bands and the middle band is determined by volatility. Parameters for the upper and lower bands are the standard deviation of the parameters used in the calculation of the moving average.
The purpose of Bollinger Bands is to provide a relative definition of price highs and lows. By definition prices are high at the upper band and low at the lower band.
The Bollinger Band default parameters are typically set to:
- 20 time periods (usually measured in days) and
- 2 standard deviations.
These parameters can (and should) be adjusted to suit the nature of the stock or commodity being traded. Bollinger recommends making small incremental adjustments to the standard deviation multiplier.
Basic Interpretation
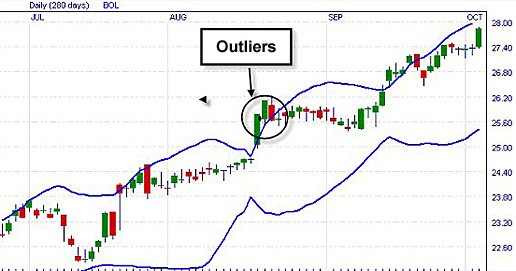
Bollinger believes the bands should contain around 90% of price action, this makes a price move outside the bands a significant event.
Using Bollinger Bands
Bollinger Bands can also be used in a variety of ways.
In an uptrend, price dips below the Simple Moving Average may be considered a buying opportunity before the next ‘tag’ of the upper band.
Bollinger bands can also be used to identify price patterns such as M-type tops and W-type bottoms.
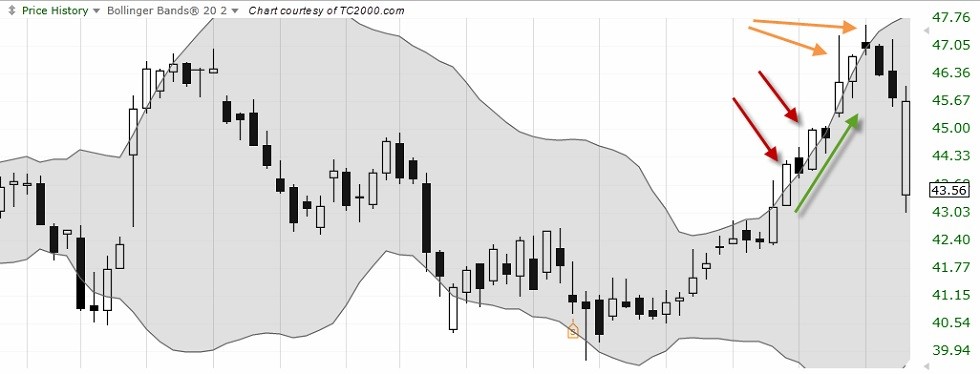
Closes outside the limits of the Bollinger Bands are often continuation signals.
Price ‘tags’ of the upper or lower bands are not considered signals. A tag of the upper Bollinger Band is NOT a confirmed sell signal, whilst a tag of the lower Bollinger Band is NOT a confirmed buy signal.
W-Bottoms
A ‘W-Bottom’ forms in a downtrend and involves two reaction lows. Bollinger looked for W-Bottoms where the second low is lower than the first, but holds above the lower band.
There are four steps to confirm a W-Bottom with Bollinger Bands. First, a reaction low forms. This low is usually, but not always, below the lower band.
Second, there is a bounce towards the middle band. Third, there is a new price low in the security this low holds above the lower band.

The ability to hold above the lower band on the test shows reduced price weakness on the last decline.
Fourth, the pattern is confirmed with a strong move off the second low and a resistance break.
M-Tops
According to Bollinger, tops are usually more complicated and drawn out than bottoms.
In its most basic form, an M-Top is similar to a double top. However, the reaction highs are not always equal. The first high can be higher or lower than the second high.
Bollinger suggests looking for signs of non-confirmation when a security is making new highs. This is basically the opposite of the W-Bottom.
A non-confirmation occurs with three steps. First, a security forges a reaction high above the upper band. Second, there is a pullback towards the middle band.
Third, price moves above the prior high, but fails to reach the upper band. This is a warning sign. The inability of the second reaction high to reach the upper band shows waning momentum, which can foreshadow a trend reversal.
Final confirmation comes with a support break or bearish indicator signal.
Conclusion
Bollinger Bands reflect direction with the 20-period SMA and volatility with the upper/lower bands and can be used to determine if prices are relatively high or low.
Technically, prices are relatively high when above the upper band and relatively low when below the lower band.
However, relatively high should not be regarded as bearish or as a sell signal. Likewise, relatively low should not be considered bullish or as a buy signal. Prices are high or low for a reason.
As with many other indicators, Bollinger Bands are not meant to be used as a stand alone tool. Confirmation should always be sort by other means.


