Introduction to Japanese Candlestick Charts
Post on: 29 Май, 2015 No Comment

Introduction to Japanese Candlestick Technical Analysis Japanese chart and candlestick pattern analysis can benefit anyone who wants to have another tool at their disposal. This is a tool that will help sort out and control the constant disruptions and continued outside influences to stocks, futures, and Forex market analysis. What does a Japanese chart offer that typical Western high-low bar charts do not?
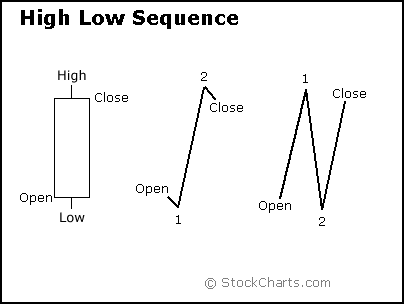
As far as the actual data displayed is concerned — nothing. Just like bar charts, Japanese Candlestick charts display the open, high, low and close of a given period of time. However, when it comes to visual recognition of data, and the ability to see data relationships and investor sentiment easier, candlesticks on a Japanese chart are exceptional.
Bar charts have little meaning by themselves whereas candle charts combine them into groups and use pattern analysis to determine the probability of market movement.
This is possible because the psychological analysis of the investor or trader becomes an important factor. Japanese candlesticks reveal quick insight to the recent trading psychology and investor sentiment. After a small amount of practice and familiarization, Japanese candlesticks will likely become part of your technical analysis methods.
Introduction to Japanese Candlestick Technical Analysis
Japanese candlesticks offer a quick view into the current trading atmosphere and investor sentiment. Candlesticks study the effect of a given market and security. Japanese candlesticks are strictly about technical analysis, and as such are not always 100% accurate because they measure the effect of market forces, including price, fundamentals and others.

When used correctly, Candlesticks are a great tool that can help you determine potential market direction. Candlesticks quantify what the traders are doing and thinking.
We cannot ignore the fact that prices are very often influenced by fear, greed, and hope. Some form of technical analysis must be used to analyze the changes in these psychological factors. Japanese candlesticks read the changes in the market’s determination of value, otherwise known as investor sentiment
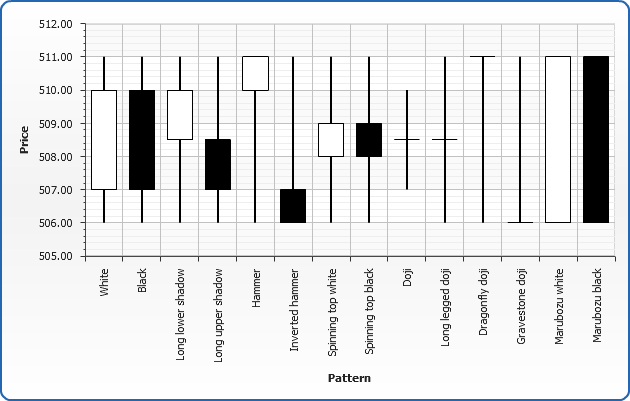
Japanese candlesticks show the interaction between buyers and sellers, which is reflected in price movement. As such, Japanese chart provides insight into the financial markets that is not readily available with a bar chart. Candlesticks work best with stocks, commodities, and Forex.
This introduction to Japanese candlestick charting and technical analysis will also provide information about the usefulness of Japanese candlestick patterns as a technical analysis tool. All methods of technical analysis and all assumptions will be open and visible.


