Introduction to Futures Trading Charts
Post on: 22 Июль, 2015 No Comment

Futures Trading Charts
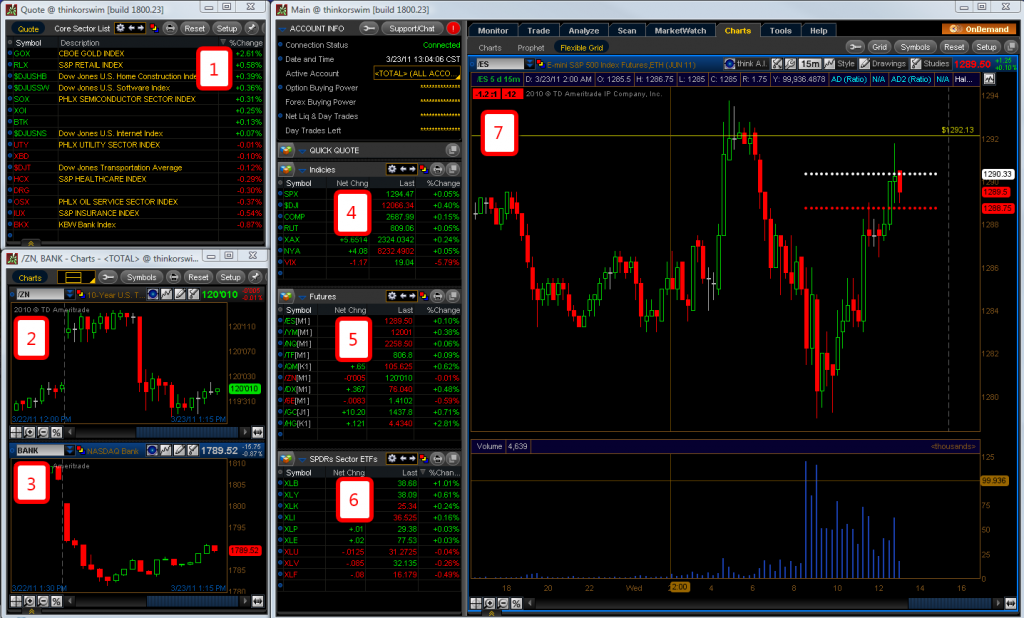
Futures trading had become easier thanks to trading platforms provided by futures brokers, everyone can trade on futures market from their home. You can buy or sell almost whatever you like, but to be a successful trader you need to know how to use a trading platform, how to use technical indicators and how to make the best decisions to be profitable.
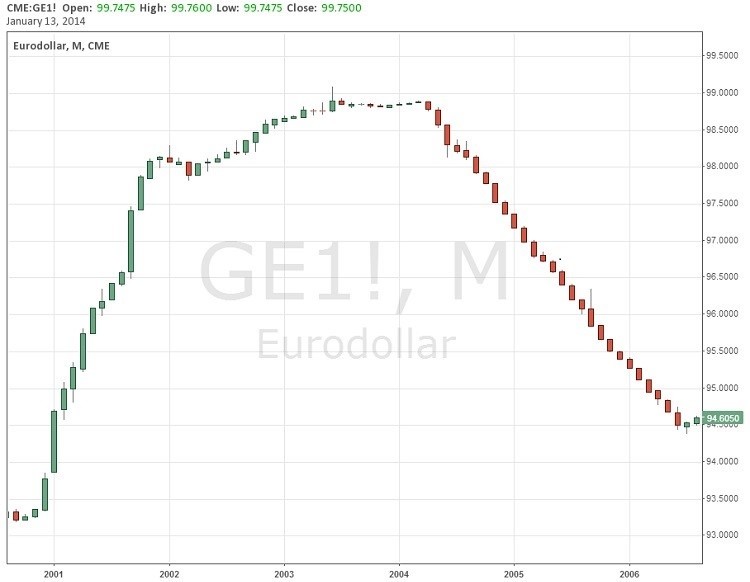
There are many types of trading charts but the most popular are: line chart, bar chart and candlestick cart. The trading chart is showing the historical price movement, you can choose what type of chart you want. The most utilized by traders are the bar charts and candlestick charts because on this charts you can read additional information, like the highest or lowest prices not only the open and close prices. Candlestick chart are very easy to use and interpret for beginners.
Chart Patterns
Chart patterns are price formations that appear on the chart, you can use these patterns as forecasting tool. There are lots of chart patterns that will help you to identify the best entry points in the market or where to place Stop loss and Take profit orders.
Is one of the most important reversal chart pattern, you can find this formation both on ascending trend but also o descending trend as inverse Head & Shoulders. When this pattern occurs, is more likely that the trend will change (Example: the ascending trend will turn into a descending trend). When the price will break the neckline and will test this level then we have a bearish signal if we have a Head & Shoulders pattern or a bullish signal if we have an Inverse Head & Shoulders.
(H – head) (S – shoulder)
2. Double Top and Double Bottom
Double top: is a reversal pattern and is formed on an ascending trend when the price has found a strong resistance and was unable to break through. If this pattern will be confirmed, then we’ll have a bearish signal.
Double bottom: is a reversal pattern and is formed on a downtrend when the price has found a strong support and was unable to break through. This will show a bullish signal if will be confirmed.
3. Symmetrical Triangle

This chart pattern is neutral, the price can break this pattern to the upside or downside, this formation can be considered a consolidation. In our case the price has broke the triangle on downside and has declined.
There are other two types of triangles, ascending and descending triangles, these are continuation patterns, is likely that the price will continue the trend.
The wedge is also a reversal pattern, looks like the symmetrical triangle but is oriented downward or upward.
Rising Wedge. occurs on uptrend, if this pattern will be broken, we’ll have a bearish signal.
Falling Wedge : occurs on downtrend, if the pattern will be broken, we’ll have a bullish signal.
There are many more chart patterns in futures trading like: Triple Top and Triple Bottom patterns, Flags and Pennants, Cup and Handle, Diamond, Broadening Top and Broadening Bottoms but you need to have some experience in trading to be able to draw and interpret these patterns.


