India VIX The Stock Market Volatility Index
Post on: 18 Июль, 2015 No Comment

As a student of market volatility, my eyes popped out in interest to learn that we have index that gives an idea about market volatility – the India Vix . India VIX is a measure of how volatile the market is expected to be over the next 30 days. Its calculation is described here in extraordinary detail. It is measured using Nifty Option prices (why do I keep reading this as Nifty onion prices?!). Here is a good non-mathematical read: How is India VIX calculated?
- It is reported as a percentage.
- A high value corresponds to high volatility in the next month and a low value corresponds to low volatility over the same period.
- It is not a buy or sell indicator.
- It is a short-term indicator of investor ‘fear’ and confidence
- As a projection, it is subject to assumptions and approximations and must be used with caution.
- India VIX is calculated based on the methodology outlined by the Chicago Board Options Exchange with some modifications made for use with the Nifty order book. They track US market volatility with VIX.
- Here is how the VIX (US) correlates with its underlying index the S&P 500.

- Notice that when VIX is low and does not fluctuate too much, investor confidence is high and the Index rises.
- Sharp drops in the index increase the fluctuations in VIX.
- Historical data for India VIX is available only from 2 nd March 2009.
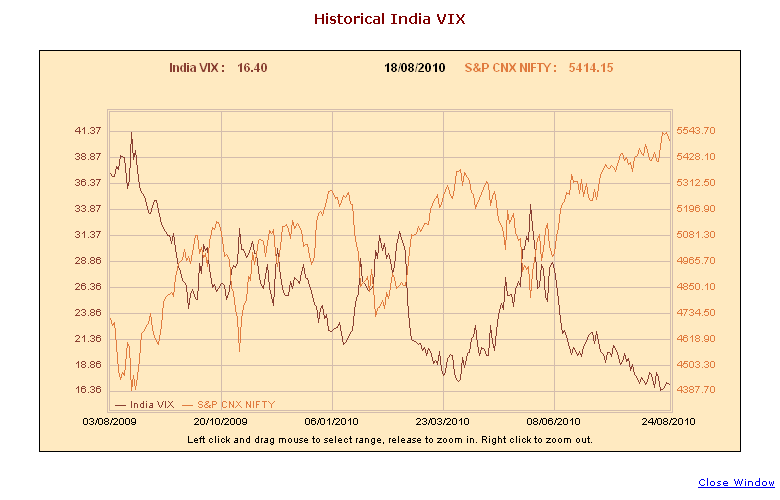
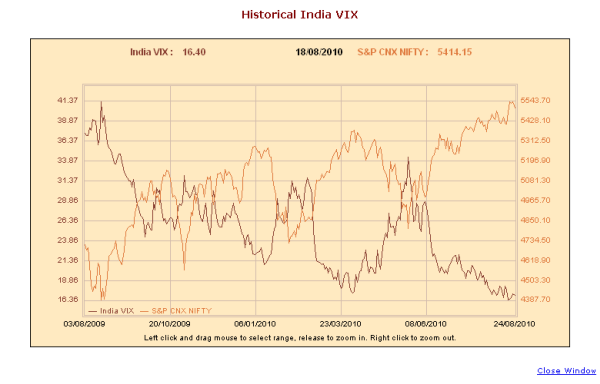
- Here is how India VIX looks like when plotted alongside the Nifty.
- There is a good 81% negative correlation between the movement of the Nifty and India VIX. That is, Nifty highs corresponds to VIX lows and vice-versa.
- Again a decreasing VIX with low fluctuations can be taken as a sign of positive outlook and a market rally at least in the short term due to increase in investor confidence and decreasing fear.
- The high volatility in 2011 is a result of global economic fears and high interest rates.
- The sharp VIX peak in Aug. 2013 corresponds to the sharp drop in the value of the Rupee.
- The volatility has been steadily decreasing for close to two years now.
- Does it mean this is a good time to invest? The VIX does not exactly tell you that. However, it does tell you that the nerves are calming down, and the confidence in the India-Growth dream is growing. Therefore, from that point of view, yes it is a good time to be in the market!
- Here is how the India VIX and Nifty P/E have evolved
- An upward spike in India VIX seems to correlate with a dip in NIFTY P/E. However, the correlation between the two is quite poor (-12%). This is to be expected as P/E considers earnings over the last 12 months.
- Curiously in late 2010, when P/E was close to 25 a clear ‘sell’ indicator, the value of India VIX was
20% a reasonably ‘low’ volatility.
- Download NIFTY, India VIX, Nifty P/E, P/B, Div. Yield data with the above charts.


