Elliott Waves Patterns in Chaos
Post on: 16 Март, 2015 No Comment

R. N. Elliott: A keen observer of market behavior
Ralph Nelson Elliott, a distinguished businessman and accountant, had a unique skill of understanding finances and mass psychology. He reorganized finances for distressed companies and entire countries.
Elliott saw Patterns in Chaos
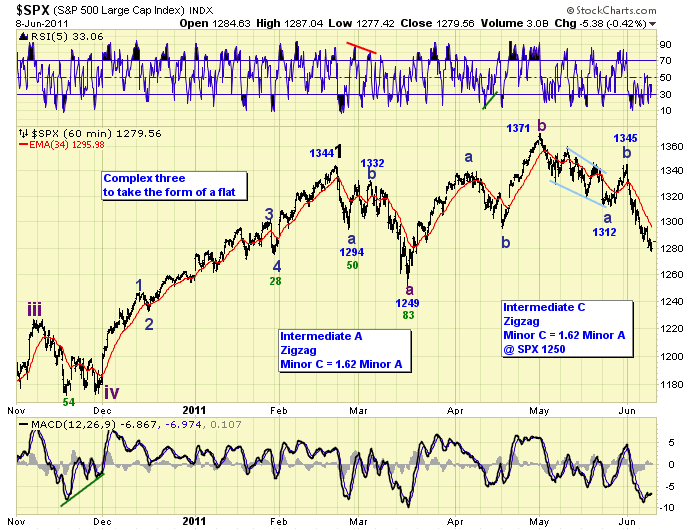
In the 1930s, Mr. Elliott studied years of stock market charts. As he observed and analyzed the market movements started to see patterns of movement. He noticed that a market would go up, for a while, and seemingly without rhyme or reason it reversed and went in the other direction. He suggested that the markets move in WAVES. He called this phenomenon The Wave Principle and titled his first book by that name.
Mass Psychology
He further asserted that the market movements were the result of mass psychology from the collective emotions of the traders. When the masses are optimistic- the market goes up and when the masses are pessimistic- the market goes down. And, when the masses are indecisive- the market goes sideways.
Elliotts Basic Eight Wave Pattern
Mr. Elliott identified a basic eight wave pattern, or sequence, that occurs in all financial markets. The pattern consists of Impulsive Waves and Corrective Waves. According to Elliott, the Impulsive Waves move in the direction of the current trend and the Corrective Waves move in the opposite direction of the trend in a counter-trend movement. I depicted Elliotts basic pattern in the image below:
The Fractal Nature of the Market
Mr. Elliott was aware of recurring, self-similar, self-replicating patterns in nature- called fractals. Here is how fractals work in financial markets. If you were to look at wave 1 and 2 under a microscope you would see that those two waves break down into another full 8 wave sequence. Then, if you were to magnify waves 1 and 2 of that smaller pattern you would see another complete 8 wave pattern. No matter how deep you go you will find the same recurring fractal patterns.

While we can not use a microscope to look at price charts we can accomplish the same thing by changing the time frame. The time frame is the amount of time it takes to complete one price bar or candlestick.
To illustrate this fractal nature I superimposed three different time frames on the chart below. The green lines represent waves 1 and 2 on the daily time frame. When you magnify waves 1 and 2 by viewing the chart on the blue hourly time frame you see the eight wave sequence again. Finally, the 15-minute time frame reveals more 8 wave sequences. This recurring fractal phenomenon, where waves self-replicate, can be seen on all time frames.
Fractal overlay
In Summary
R.N. Elliott. in the 1930s, saw patterns in chaos in the financial markets. He identified a basic 8-wave fractal pattern that recurs over all time frames. He taught that market movements were the result of mass psychology and the collective emotions of traders. His discovery is now known as Elliott Waves. Many traders use the Elliott Waves to anticipate changes in market direction.
For those interested in learning more about how to trade Elliott Waves Jody Samuels teaches an Elliott Wave course that also combines her Wavy Tunnel Strategy. It is certainly worth checking out.


