Day Trading Strategies Day Trading Futures using Trend lines to define Channels Doubletops and
Post on: 2 Август, 2015 No Comment

Tuesday, July 27, 2010
Day Trading Futures using Trend lines to define Channels, Double-tops and bottoms
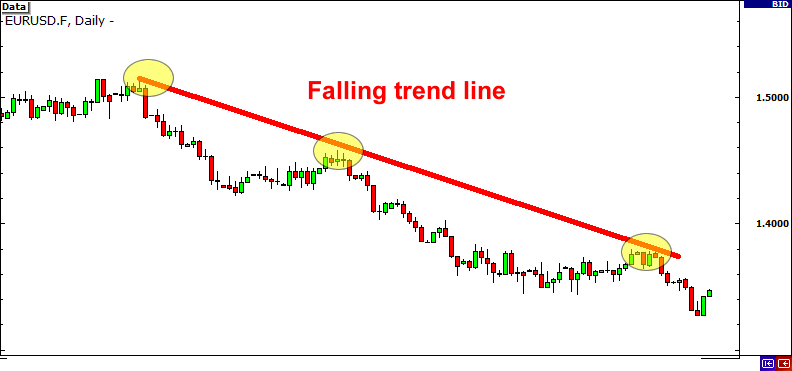
One of the easiest ways to make profits in these slow summertime markets is use simple trend lines to define the trading range, and then look for opportunities to sell the highs and buy the lows.
This is much easier said than done, and in todays video we discuss the many ways we profit from using simple patterns in sideways markets to make profit every day.
- Stops and targets for the 13-range and 21-range trades
o Recoded members trainings from the past month have discussed this topic as well.
o ATM strategies for the LONGER term trades will be different for each trade
 We use the market to tell us where to place our stops and targets.
 How would you set up the ATM Strategy :
Stop = 20 ticks
Targets = 20/30/40
Stop Strategy = NONE.
Remember, these are NOT final numbers, this is just to get your stop and your targets in the market
Then youll move your stops and targets to the correct location.
- Trading a channel pattern
o Drawn using 2 trend lines that are parallel to each other.
o Made easier by copying and pasting 1 of the trend lines above/below the first trend line.
o Channel is treated very similar to a sideways market (sideways bracket)
o Buy the lows, sell the highs
o Be careful trying to predict when the channel will be broken.
- Best way to sell the highs and buy the lows
o Define where the Highs And Lows are!
o Define your sideways range
 Look for flat trigger lines
 Look for slow and sluggish levels of price
o Once we define our sideways range, then what?
 Mark down the levels somewhere convenient so you can know where they are in the future
 Use our Price Alert indicator to give me an alert when the price tests the highs or the lows.
 I need to find my sideways range on a SLOWER timeframe chart
Slower timeframe chart dont give us the best entries
 I need to find the best ENTRIES on a faster chart
4-range, 8-range, 13-range, etc.
o Once I spot my entry pattern on the fast chart, I need to prep for my stops and targets
 Use the 21-range chart (example) for my stops and my targets.
Stops and targets are placed using the next levels of support and resistance on the chart you are trading.
- Where do we trade? Around Red Line ?
o What about the other lines? Do we skip those?
o Always trade around the RED LINES as much as possible.
 The closer we are to the RED LINEs for our entries the LOWER the risk
 The further away from the RED LINES for our entries the HIGHER the risk
o This is a new version, and everything online is current
o Locate levels on your SLOW chart, and then like magic will post those same levels on your FAST chart

o It also adds big round number, and double-tops and bottoms.
- Fast Track Trade Management
o There is NO trade management on the fast track
 You are only trading 1 contract, so no Trade Management
 If you want to trade larger size, you can trade more size, but keep the 1 stop and 1 target intact.
- Red Pace of Tape, can we trade it?
o Blog has the info on how to use it
o Available to our advanced members only
o Counts the speed of the orders coming into the market
o Does not count volume, it simply measures the SPEED of the market.
o Im concerned with RED pace of tape because that means the market is moving very slowly.
 I will avoid trading around DECREASING red pace of tape
 I will take a trade with INCREASING pace of tape because that may be the beginning of the move!
 same pot. except for ES, FESX, Bonds, T-Notes, anything HIGH VOLUME
- Time & Sales Window, gray background
o At high of day, it means buyers @ highs
o At low of day, it means sellers @ lows
- Focus on 1 market:
o Gold, Euro, Russell, Aussie
 Fast track trading method
o More experience, Crude Oil


