Commodity Chart Trend Indicators
Post on: 6 Июль, 2015 No Comment

Futures chart trends are a term used to describe the persistence of price movement in one direction over time. Trends move in three directions: up, down and sideways. Within a trend, markets do not move consistently in one direction, but tend to be erratic; thus trends are characterized by a series of peaks and troughs. Trend indicators smooth variable price data to create a composite of market direction.
. >Moving averages (MA)
Moving averages tend to smooth out the ups and downs of daily price swings and give a better view of the underlying price trend. Because moving averages tend to lag behind current prices, a change in direction in a moving-average is a strong indication of a change in price.
A moving average plots the average of a chosen price over a defined period of time as a line on a chart. The price used can be the opening. closing, highest, lowest (etc.) price of each bar, the average is the high and low, or the average of the high, low and close. The most common value to use is the close. (Closing prices are significant as they represent positions investors are willing to carry overnight.) The period of time can be from 2 bars to an infinite number of bars. Over time, the newest price is added and the oldest is dropped, according to the time period used. For example, with a three-day moving average, the first point plotted on the chart will be the average closing price for days one, two and three. The second point will be the average price for days two, three and four, the third will be for days three, four and five, and so on. The shorter the time span, the more sensitive the moving average will be to price changes, and vice versa for longer time spans.
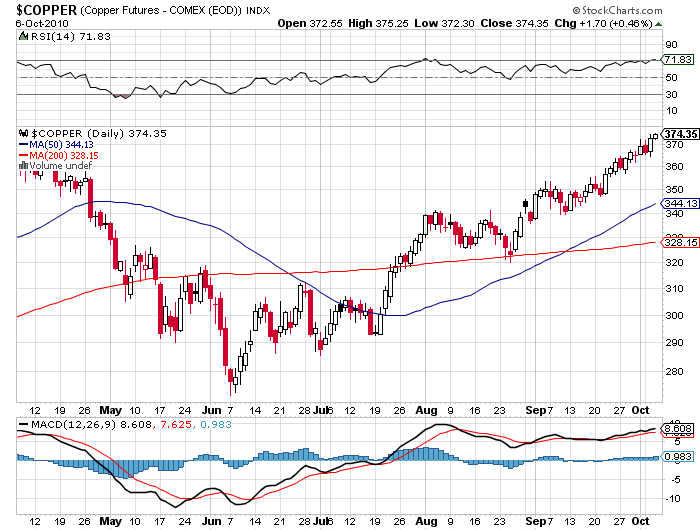
A buy signal occurs when price crosses above the moving average and the moving average is directed upward. A sell signal occurs when price crosses below the moving average and the moving average is directed downward. Several moving averages can also be plotted on the same chart. A buy signal occurs when the shorter moving average crosses above the longer moving average and both moving averages are in an upward direction. (Vice versa for sell signals.) Reversals in moving average direction are usually more reliable than a moving average crossovers.
When price is trnding sideways, false signals can occur, thus it is a good idea to use other indicators to confirm signals. Also to note, a moving average can act as price support and resistance lines.
In an uptrend, if price crosses above the moving average, it is a buy signal; long positions are maintained as long as price remains above the moving average. If price falls to a moving average but doesn’t cross it and then moves back up, another buy signal is generated. If price drops sharply below the moving average, a rebound toward the moving average line may occur resulting in a whipsaw. (Vice versa for a downtrend.)
There are different types of moving averages:
. >Simple Moving Average
the value of a series of prices is added together and then divided by sum number of instances. A change in trend is when the MA cuts through price bars, or, when using 2 MA’s, the shorter avarage crosses the longer average.
. >Weighted Moving Average
the previous data is weighted with more importance than recent data. Commonly, one multiplies price values with their position in the series, adds up the entire sum and then divides by the sum of number instances. To interpret a weighted MA, look at changes in direction rather than crossovers. Weighted moving averages overcome the signal delays of simple moving averages.by givin more weight to recent data For example, for a 5 day weighted moving average, multiply the first data by 1; the second by 2; the third by 3; the fourth by 4 and the fifth by 5. Then divide this sum by the sum of the weights. In this case, the divisor is 1 2 3 4 5= 15. The sum of the data is divided by 15. A buy or sell signal is given when the weighted moving average changes direction.
:. >Exponential Moving Average
the previous data is weighted with more importance than recent data. One calculates a simple MA, then calculates the difference of each price instance from this simple MA. Next, one multiplies these difference values by an exponent. The resultant fractional value is added to the simple MA. The exponent used depends on the length of MA: (The following values are presented as multiples to make the exponential MA easier to use. Don’t worry, the results remain exponential!)
5 prices —> 0.4
10 prices —> 0.2
15 prices —> 0.13
20 prices —> 0.1
40 prices —> 0.05
80 prices —>0.025
. >Moving Average Bands
Moving Average Bands are moving averages some distance above and below any type of MA. The bands are ‘parallel’ to the center MA in that these follow the same course as the center MA. They represent maximum and minimum divergences of prices from the MA in middle.
. >Qstick Indicator

The Qstick Indicator is a moving average of the difference between opening and closing prices. Indicator values below zero indicates a bearish bias, above zero indicates a bullish bias.
. >Linear Regression Trendline
A Linear Regression Trendline uses a least squares method to plot a straight line through prices so as to minimize the distance between all prices and the resulting regression line. This trendline is like the equilibrium price of a particular trend. Any excessive deviation from trendline should be short-lived and counter-trend.
There are two ways to use linear regression. The first is to trade in the direction of the linear regression line. The second is to plot the linear regression line and two parallel equidistant lines above and below it. To determine the distance, use a point which is the furthest away from the linear regression line on the price bar. The two lines act as support and resistance. Once the lines are broken for a sustained period of time, this is an indication that the trend has reversed or gained tremendous momentum.
The space inside the channel is where equilibrium exists, where prices can be expected to deviate from the original linear regression line. As with Bollinger Bands, when prices move outside or to the extreme channel line, price tends to move back to the opposite channel line.
Standard Error is the measure of standard variation around a regression line and determines the accuracy of the regression. It measures how close prices congregate around a linear regression line. The closer to the line, the lower the standard error and the stronger the trend. Changes in price trends are usually preceeded by an increase in standard error around the regression trendline.
. >Time Series Forecast
A Time Series Forecast equals the endpoint value of a linear regression trendline plus its slope.
. >Vertical Horizontal Filter
Vertical Horizontal Filter compares the sum of a one-period rate of change to the range between high and low prices over the specified period to determine whether prices are in a trend or congestion phase. Any values above or below certain levels indicate trending. Also, if the VHF is rising, it indicates trend development; if it is falling it indicates congestion development.
Trendlines are lines drawn between two or more prominent price points on a chart, either the lowest points or highest points. Their importance depends on how often prices touch them. The length of the trendline and the sharpness of trendline angle determines if a breakthrough is significant. Once a trend is drawn, it will remain intact until broken. To forecast the size of a breakthrough, measure the maximum divergence (before the breakthorugh) of price from the trendline and then extrapolate that distance from the breakout point as a minimum goal. Trendlines can be upward, downward or horizontal and act as support and resistance of trend.


