Chart patterns Analysis
Post on: 20 Апрель, 2015 No Comment

Chart patterns Analysis
What are Chart Patterns?
- Chart Patterns Analysis falls under the category of Technical Analysis . Chart pattern is a term of technical analysis used to analyze a stock’s price action according to the shape its price chart creates. Trading by chart patterns is based on the fact that once a chart forms a pattern the short term price action is predictable to an extent. For instance, if a chart creates a channel the stock price will be bouncing off the upper and lower boundary until it breaks out. Based on each pattern’s rules many different trading strategies can be applied.
- Trading with technical analysis requires correctly identifying chart patterns. Technical analysis is the study of price history to determine future trading opportunities. Price history in the form of a price chart is the visual representation of where prices have been, where buyers and sellers hide for making profit, and often times the trading psychology and mentality at work in the market.
- Chart patterns are useful indicators of momentum, support and resistance, and other indications of strength or weakness in a stock. Chart patterns help traders to determine market direction as well as time entries and exits. A trader must be able to identify chart patterns properly. Only then can a trader benefit from chart patterns.
Technical Analysis Theory/ Assumptions

There are three basic assumptions on which technical analysis is based:
1. The futures market discounts everything.
It is believed that the price displayed at the commodity exchange at any given time is the intrinsic value of the commodity based upon the fundamental factors affecting the supply and demand of the product. Therefore, if the fundamentals are already reflected in the price, market action (charts- price, volume, open interest), it is all that which is needed to study forecast future price direction. By not being aware of the fundamental news, he is able to study the fundamentals of the market place by analyzing the charts 2. Prices move in trends
Prices can move in one of three directions, up, down or sideways. Once a trend in any of these directions is in effect it usually will persist. The market trend is simply the direction of market prices, a concept which is absolutely essential to the success of technical analysis. Identifying trends is quite simple; a price chart will usually indicate the prevailing trend as characterized by a series of waves with obvious peaks and troughs. It is the direction of these peaks and troughs that constitutes the market trend. 3. History repeats itself
Technical analysis includes the psychology of the market place. Patterns of human behavior have been identified and categorized for several hundred years and are repetitive in nature. The repetitive nature of the marketplace is illustrated by specific chart patterns which will indicate a continuation of or change in trend.
Types of Chart Patterns
There are two types of patterns within technical analysis. Reversal and Continuation Patterns. A reversal pattern signals that a prior trend will reverse upon completion of the pattern. A continuation pattern, on the other hand, signals that a trend will continue once the pattern is complete. Continuation patterns, when they occur, indicate that a price trend is likely to continue.
- Reversal patterns often take a long time to form on the chart and represent major changes in trend. The larger the pattern, the greater the potential price movement. The height of the pattern measures volatility, while the width measures time required to complete the pattern. (Patterns at market tops are usually more volatile and shorter in time than bottoms.) Some of the common reversal patterns are Double Top, Double Bottom, Head & Shoulders Top, Head & Shoulders Bottom etc.
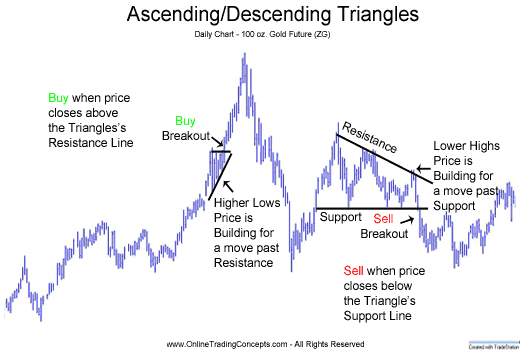
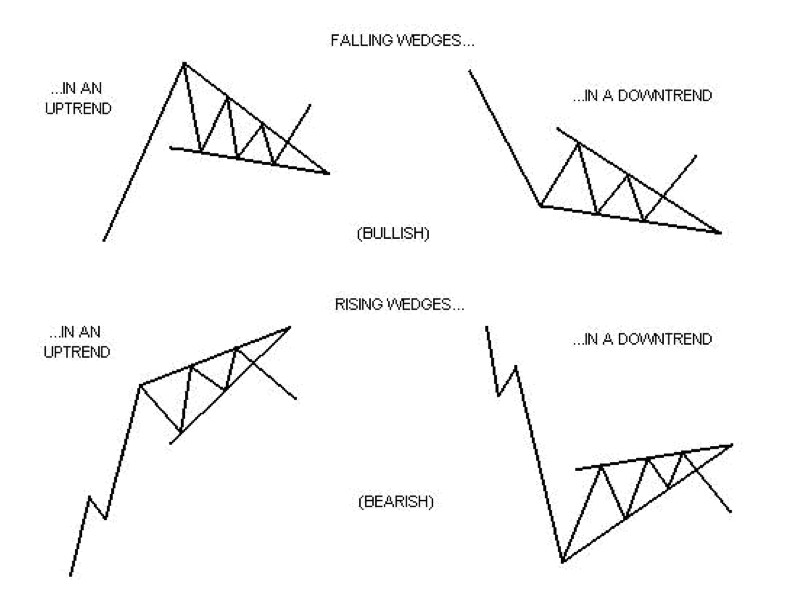
- Continuation patterns suggest that a market is only pausing for a while before the prevailing trend will resume. Continuation patterns are usually shorter-term in duration than reversal patterns and are often classified as intermediate-term chart patterns. Some of the most common continuation patterns include: flags, ascending and descending triangles, pennants, gaps, and rectangles.
Candlestick Charts
The candlestick charts have become very popular among traders as they compress all important information such as the session’s open, high, low, and close into a space-efficient symbol called candlestick.


