CBOT Market Profile® and Liquidity Data Bank TradingNaked
Post on: 24 Май, 2015 No Comment

Traditional technical analysis uses historical market-generated information to solve for profitable technical indicators by the process of optimization/back-testing; the resultant indicators are used to monitor market behavior on a day-to-day basis. This approach to technical analysis allows the market participant to deal with the markets on a part-time basis.
Market Profile is a form of technical analysis, in that it utilizes market-generated price and volume data. However, it differs from traditional analysis, in that market behavior is monitored throughout the trading session. In order to gain market understanding, the profile trader observes the market in real-time, either on the trading floor, or away from the floor via price-quotation equipment.
Following more than four years of development by J. Peter Steidlmayer and the Chicago Board of Trade (hereinafter, CBOT), the CBOT Market Profile and Liquidity Data Bank went on-line in 1984. The first vendor of the data was Donald L. Jones.
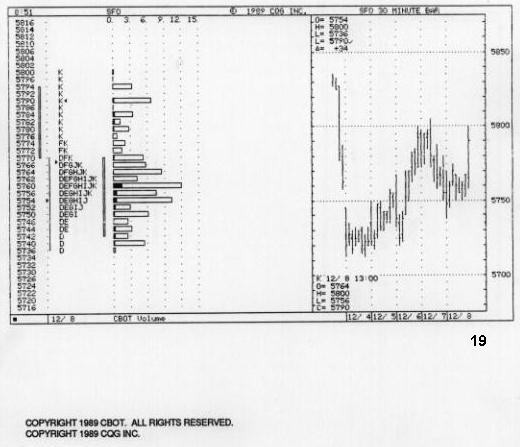
Figure 19 below displays a Market Profile graphic with CBOT Volume, and a 30-minute bar chart of CBOT January 1990 soybean futures for December 8, 1989. The graphic is a real-time, time-and-sales quotation ticker that displays time/price relationships. The letters comprising the graphic designate the following standard 1/2-hour time periods: A represents 8:00-8:30 A.M. Central Time, B represents 8:30-9:00, and so on. The price of SF0 ranged between 5770 and 5736 during the D period (the first period of this market), between 5762 and 5744 during the E period, and so on. The day’s open and last prices are designated by the two triangles appearing adjacent to 5754 and 5790, respectively, while the third triangle designates the middle of the day’s price range.
Each letter comprising the graphic is a time-price-opportunity (hereinafter, TPO); a TPO is an opportunity to trade in a specific 1/2-hour period at a specific price.
Figure 20 illustrates the formation of the graphic that is displayed in the previous figure. In Figure 20, trading activity is depicted with the TPOs displayed as a 30-minute bar chart; with the TPOs left-justified, the conventional profile graphic® displayed in Figure 19 results.
The CBOT Volume presented in turquoise at the left side of Figure 1 is generated from the CBOT Liquidity Data Bank. It is the distribution of contract volume at each tick over the day’s price range, and is presented both numerically and graphically.
With the availability of the CBOT Market Profile and LDB. the general public has access to market-generated information which previously had been available only to individuals who trade on exchange floors. Thus, it is possible to get the feel of a market, while trading away from the floor.
Market Profile
Some individuals trade, on the one hand, by following market fundamentals and/or by conducting technical analysis; as seen in previous chapters, the intent may be to trade by using some system or formula which is construed to represent market behavior. On the other hand, the discipline popularly known as market profile entails understanding what is happening in the market, thinking about it logically, and acting accordingly.
The Market’s Purpose

The purpose of a market is to accommodate trade. Futures exchanges promote trade accommodation by providing such things as a location at which to trade, market-imposed time-frames (for example, the hours of the trading session, the life of futures contracts, and the timing of market reports), and the information captured in the profile graphic and the volume distribution.
The Market’s Operational Procedure
The market is self-regulating through the use of time and price, and market activity is interpreted by the acceptance or rejection of TPO’s by market participants. The market operates through a dual auction process. As it is attempting to accommodate trade, the market seeks the activity of participants through rotation: that is, as can be seen in Figure 20, it uses price probes which move, alternatively, too high and too low in order to create trading opportunities. The acceptance or rejection of these TPO’s by market participants is a function of their needs and objectives.
The Behavior of Market Participants
Market participants are categorized by their time-frames. Day-time-frame traders intend to conduct business in a specific trading session. They seek a fair price in order to accommodate trade: that is, they operate to buy the bid price, or to sell the asking price, so as to take the edge.
Other-time-frame traders, who may not initially intend to conduct business in a specific trading session, may acquire a market position because of an attractive TPO. Their usual mode of behavior is to fade the market: that is, they usually operate to buy at the low end of the day’s price range, or to sell at the high end.


